
Template talk:Weather box/Archive 7
| This is an archive of past discussions. Do not edit the contents of this page. If you wish to start a new discussion or revive an old one, please do so on the current talk page. |
| Archive 1 | ← | Archive 5 | Archive 6 | Archive 7 | Archive 8 | Archive 9 | Archive 10 |
"For precipitation/rain colour - there is no consensus"
My edits were reverted by a user here as I added the green colour precipitation for a number of cities (say around 130 cities, give or take, which were mainly large cities/capitals). I wouldn't have stressed to myself to go as far as small towns (not unless if I knew them). So the blue colours were still around in many other articles. Not to mention, a number of climate boxes didn't allow green precipitation.
Anyway, the user told me (should I use his name?) that "There is consensus for blue rain in Wikipedia (formerly also as status quo), please do not add green option to climate sections of articles." Just above they said that there wasn't a consensus, but now he told me that there is? Can anyone please clarify this? Can some of my edits be reverted at least (I can do them personally to spare your time)?
Her are my reverted additions - start from 13:58, 4 December 2013 (Dakar) to 08:15, 4 December 2013 (Prospect):
My reverted 'green precipitation' cities
Oh, I just voted up there. Apologies if I was 7 months late. I believe the votings were closed, no?
Thanks for your help. Meganesia (talk) 12:45, 5 December 2013 (UTC)
- I do not think that there is formally a consensus on blue colours being used in for precipitation. However, since the template has not been changed in a while, I am pretty sure there is a silent consensus, implying that blue colours is the norm, which is a weak consensus. I am sure that the need for the change for precip colours has been for around for a while and that disputes have occurred over time. Also, it is kind of wrong just to revert edits just because it is against consensus, especially with a weak consensus. So far, I see that the vote is split and would imply that there is no consensus on which colours to use. Like all the other users, you do give good reasons why to change the colours. Ssbbplayer (talk) 02:55, 5 December 2013 (UTC)
- Thank you for your answer. Can I at least re-revert the some of them (if not all)? I felt degraded to see ALL my edits reverted, especially, as you said, when there wasn't even a FORMAL consensus (unfair a little, no?). A user even 'wiki-thanked' me after I 'greened' a certain city in Italy - It seems people favour the 'green'. Why must I leave the 'blue' just to impress that one user who reverted all my additions? Do you have a solution for this? I believe I can revert HIS reverts by using this Wiki saying against him: Don't revert due solely to "no consensus", if that's fine? Meganesia (talk) 3:42, 5 December 2013 (UTC)
- It would be best not for neither of you to get into an edit war over the colours. Of course as per usual if the rain/precipitation is green the snow, which is a type of precipitation should also be green. CambridgeBayWeather (talk) 13:18, 5 December 2013 (UTC)
Meganesia, currently:
- there is slight consensus
- previously and also partly currently existed status quo
- there are still objections, comments, new ideas - there are still discussion (for example violet colour for cold temperatures or other) - so, absolutely should pause of change colours, absolutely unacceptable changes on a large scale (dozens, hundreds changes in articles).
- in this case works the principle of Wikipedia:CYCLE (edit, revert = discussion and consensus), so.... your edit, revert (for example by me) = must to be discussion and consensus
- in particular, other (not all, but sufficient that part of the) users (including me) are opposed to your change, so... must to be consensus.
Generally, as you can see (five sentences above), your changes can not be done. Subtropical-man (talk) 17:17, 5 December 2013 (UTC)
PS. your main reason for your change is relation between low (often blue) temperatures with blue precipitations but according to vote, there is clear consensus (voting result: 5:1) for violet average low temperature colour, so - the problem ended (also there is consensus for snowfall colour - blue, voting result: 4:1:1). For some time low (currently often blue) temperatures will be changed to violet, according to the consensus. Currently still being discussed about radiation/varieties of violet to use. Subtropical-man (talk) 18:06, 5 December 2013 (UTC)
Oh my! Meganesia, you made some false edits regarding climate classification that I had to revert! --Mahmudmasri (talk) 03:49, 24 January 2014 (UTC)
I really can't revert all of them. That's very hideous :( Please make the correct calculations from there, Köppen climate classification, before falsely changing correct climate classifications. Using primitive descriptions like, warm temperate, is very vague. --Mahmudmasri (talk) 03:59, 24 January 2014 (UTC)
Cleanup category for articles with both imperial first and metric first
I found today that User:Guardian of the Rings ran an automated script last year to add "imperial first = Y" to a large number of articles (this param is not referenced by this template directly, but rather by Module:WeatherBox). However, it was added to articles which already contained "metric first = Y". When these parameters occur together, the C and F data ends up being displayed in reverse - the C data is labelled as F, and vice versa.
I'd like to add a cleanup category in this template to catch articles that use both of these parameters, so they can be fixed eventually. I haven't touched a template this complicated in a few years... where's the best place in the template code to put this? Or any ideas on a better way to do this. — RockMFR 17:01, 2 February 2014 (UTC)
- Would it not be possible to just have a bot remove one of them when the two occur together. Also to add the "imperial first = Y" to all US articles that use the template? CambridgeBayWeather (talk) 22:13, 2 February 2014 (UTC)
- It would be better if a bot can automatically add "imperial first=Y" to all US articles or any article that uses imperial units. It is extremely difficult for one user to it and it's time consuming. However the weather box needs to use metric units by default since most of the world uses the metric system. That way, there would be no need for the line "metric first=Y") Currently, if this line was removed, the weather box displays imperial units by default. Ssbbplayer (talk) 18:31, 10 February 2014 (UTC)
- Ssbbplayer said: "Currently, if this line was removed, the weather box displays imperial units by default" - yes, this is error. Most of countries in the world use metric system, metric system should be as default. Need to improve code of weatherbox. Subtropical-man talk
(en-2) 19:18, 10 February 2014 (UTC)
- Ssbbplayer said: "Currently, if this line was removed, the weather box displays imperial units by default" - yes, this is error. Most of countries in the world use metric system, metric system should be as default. Need to improve code of weatherbox. Subtropical-man talk
- It would be better if a bot can automatically add "imperial first=Y" to all US articles or any article that uses imperial units. It is extremely difficult for one user to it and it's time consuming. However the weather box needs to use metric units by default since most of the world uses the metric system. That way, there would be no need for the line "metric first=Y") Currently, if this line was removed, the weather box displays imperial units by default. Ssbbplayer (talk) 18:31, 10 February 2014 (UTC)
Violet temperature colour schemes
We need to decide which violet colour scheme is the best. There are a lot of options to choose Here are some examples below (from the previous discussion).
Option 1
{{#invoke:Gradient| gradient_test | gradient=
  {{#invoke:Gradient|export_gradient
  | 0 | #E6E6FA
  | -45 | #B57EDC
  | -90 | 000000
  }}
| step = 1
| cells_per_row = 25
}}
| -90 -90 |
-89 -89 |
-88 -88 |
-87 -87 |
-86 -86 |
-85 -85 |
-84 -84 |
-83 -83 |
-82 -82 |
-81 -81 |
-80 -80 |
-79 -79 |
-78 -78 |
-77 -77 |
-76 -76 |
-75 -75 |
-74 -74 |
-73 -73 |
-72 -72 |
-71 -71 |
-70 -70 |
-69 -69 |
-68 -68 |
-67 -67 |
-66 -66 |
| -65 -65 |
-64 -64 |
-63 -63 |
-62 -62 |
-61 -61 |
-60 -60 |
-59 -59 |
-58 -58 |
-57 -57 |
-56 -56 |
-55 -55 |
-54 -54 |
-53 -53 |
-52 -52 |
-51 -51 |
-50 -50 |
-49 -49 |
-48 -48 |
-47 -47 |
-46 -46 |
-45 -45 |
-44 -44 |
-43 -43 |
-42 -42 |
-41 -41 |
| -40 -40 |
-39 -39 |
-38 -38 |
-37 -37 |
-36 -36 |
-35 -35 |
-34 -34 |
-33 -33 |
-32 -32 |
-31 -31 |
-30 -30 |
-29 -29 |
-28 -28 |
-27 -27 |
-26 -26 |
-25 -25 |
-24 -24 |
-23 -23 |
-22 -22 |
-21 -21 |
-20 -20 |
-19 -19 |
-18 -18 |
-17 -17 |
-16 -16 |
| -15 -15 |
-14 -14 |
-13 -13 |
-12 -12 |
-11 -11 |
-10 -10 |
-9 -9 |
-8 -8 |
-7 -7 |
-6 -6 |
-5 -5 |
-4 -4 |
-3 -3 |
-2 -2 |
-1 -1 |
0 0 |
Option 2
{{#invoke:Gradient| gradient_test | gradient=
  {{#invoke:Gradient|export_gradient
  | 0 | #8F00FF
  | -90 | 000000
  }}
| step = 1
| cells_per_row = 25
}}}
| -90 -90 |
-89 -89 |
-88 -88 |
-87 -87 |
-86 -86 |
-85 -85 |
-84 -84 |
-83 -83 |
-82 -82 |
-81 -81 |
-80 -80 |
-79 -79 |
-78 -78 |
-77 -77 |
-76 -76 |
-75 -75 |
-74 -74 |
-73 -73 |
-72 -72 |
-71 -71 |
-70 -70 |
-69 -69 |
-68 -68 |
-67 -67 |
-66 -66 |
| -65 -65 |
-64 -64 |
-63 -63 |
-62 -62 |
-61 -61 |
-60 -60 |
-59 -59 |
-58 -58 |
-57 -57 |
-56 -56 |
-55 -55 |
-54 -54 |
-53 -53 |
-52 -52 |
-51 -51 |
-50 -50 |
-49 -49 |
-48 -48 |
-47 -47 |
-46 -46 |
-45 -45 |
-44 -44 |
-43 -43 |
-42 -42 |
-41 -41 |
| -40 -40 |
-39 -39 |
-38 -38 |
-37 -37 |
-36 -36 |
-35 -35 |
-34 -34 |
-33 -33 |
-32 -32 |
-31 -31 |
-30 -30 |
-29 -29 |
-28 -28 |
-27 -27 |
-26 -26 |
-25 -25 |
-24 -24 |
-23 -23 |
-22 -22 |
-21 -21 |
-20 -20 |
-19 -19 |
-18 -18 |
-17 -17 |
-16 -16 |
| -15 -15 |
-14 -14 |
-13 -13 |
-12 -12 |
-11 -11 |
-10 -10 |
-9 -9 |
-8 -8 |
-7 -7 |
-6 -6 |
-5 -5 |
-4 -4 |
-3 -3 |
-2 -2 |
-1 -1 |
0 0 |
Option 3
{{#invoke:Gradient| gradient_test | gradient=
  {{#invoke:Gradient|export_gradient
  | 0 | #E6E6FA
  | -15 | #B57EDC
  | -50 | #8F00FF
  | -90 | 000000
  }}
| step = 2
| cells_per_row = 25
}}
| -90 -90 |
-88 -88 |
-86 -86 |
-84 -84 |
-82 -82 |
-80 -80 |
-78 -78 |
-76 -76 |
-74 -74 |
-72 -72 |
-70 -70 |
-68 -68 |
-66 -66 |
-64 -64 |
-62 -62 |
-60 -60 |
-58 -58 |
-56 -56 |
-54 -54 |
-52 -52 |
-50 -50 |
-48 -48 |
-46 -46 |
-44 -44 |
-42 -42 |
| -40 -40 |
-38 -38 |
-36 -36 |
-34 -34 |
-32 -32 |
-30 -30 |
-28 -28 |
-26 -26 |
-24 -24 |
-22 -22 |
-20 -20 |
-18 -18 |
-16 -16 |
-14 -14 |
-12 -12 |
-10 -10 |
-8 -8 |
-6 -6 |
-4 -4 |
-2 -2 |
0 0 |
Put your comments below. Ssbbplayer (talk) 18:35, 5 December 2013 (UTC)
Of course, the code can be changed freely. You can choose different shades, and experiment further, if these three examples are not sufficient for someone. Subtropical-man (talk) 18:42, 5 December 2013 (UTC)
- I sort of like the 3rd one. The first, btw, turns into bluish at the bottom (not good, too similar to blue precipitation). The 2nd one is awful; it's rather dull, monotonous and hardly gradual. Meganesia (talk) 12:24, 6 December 2013 (UTC)
- Definitely, the second one is not the best one. The colours are already quite dark at the lower values and the gradient is weak meaning the colours look almost the same at different values. Option 1 and option 3 are both good. Ssbbplayer (talk) 17:11, 6 December 2013 (UTC)
What do you think about this? (below)
<nowiki>{{#invoke:Gradient| gradient_test | gradient=
  {{#invoke:Gradient|export_gradient
  | 0 | #ffffff
  | -15 | #B57EDC
  | -35 | #8806CE
  | -65 | #4C2882
  | -90 | 000000
  }}
| step = 1
| cells_per_row = 25
}}}
| -90 -90 |
-89 -89 |
-88 -88 |
-87 -87 |
-86 -86 |
-85 -85 |
-84 -84 |
-83 -83 |
-82 -82 |
-81 -81 |
-80 -80 |
-79 -79 |
-78 -78 |
-77 -77 |
-76 -76 |
-75 -75 |
-74 -74 |
-73 -73 |
-72 -72 |
-71 -71 |
-70 -70 |
-69 -69 |
-68 -68 |
-67 -67 |
-66 -66 |
| -65 -65 |
-64 -64 |
-63 -63 |
-62 -62 |
-61 -61 |
-60 -60 |
-59 -59 |
-58 -58 |
-57 -57 |
-56 -56 |
-55 -55 |
-54 -54 |
-53 -53 |
-52 -52 |
-51 -51 |
-50 -50 |
-49 -49 |
-48 -48 |
-47 -47 |
-46 -46 |
-45 -45 |
-44 -44 |
-43 -43 |
-42 -42 |
-41 -41 |
| -40 -40 |
-39 -39 |
-38 -38 |
-37 -37 |
-36 -36 |
-35 -35 |
-34 -34 |
-33 -33 |
-32 -32 |
-31 -31 |
-30 -30 |
-29 -29 |
-28 -28 |
-27 -27 |
-26 -26 |
-25 -25 |
-24 -24 |
-23 -23 |
-22 -22 |
-21 -21 |
-20 -20 |
-19 -19 |
-18 -18 |
-17 -17 |
-16 -16 |
| -15 -15 |
-14 -14 |
-13 -13 |
-12 -12 |
-11 -11 |
-10 -10 |
-9 -9 |
-8 -8 |
-7 -7 |
-6 -6 |
-5 -5 |
-4 -4 |
-3 -3 |
-2 -2 |
-1 -1 |
0 0 |
I experimented a little with the shades from Shades of violet. Subtropical-man (talk) 21:00, 7 December 2013 (UTC)
- The first color scheme looks good to me. I was surprised to see you go as low as -90 in your table, but it makes sense after I figured out that the coldest temperature recorded on earth was -89,2 at Vostok Station. Violet would be appreciated so we can settle on using blue for precipation. I wish we could finally make a decision and get this over with, can we vote on this (I'm not aware of how decision making here works)? --AlexanderVanLoon (talk) 20:13, 8 December 2013 (UTC)
I already suggested that violet-fuchsia-purple tints be used for ultraviolet radiation, not temperatures :( --Mahmudmasri (talk) 02:59, 7 January 2014 (UTC)
- This shade looks better than the 3 options above. I think it would go well with it. About the comment on UV radiation, I do not see how purple can be used for UV radiation because there are few climatological data on UV radiation. Even so, it would seem pointless to put it in the weather box compared more important info such as sunshine hours, temperature and precipitation. I would prefer describing the climate about its UV radiation as a summary instead. Ssbbplayer (talk) 17:11, 24 February 2014 (UTC)
Subtropical-man
You really need to calm down and stop harassing editors, claiming that I mass-change colors of climate charts. Most of your claims were on charts I took time and effort to create. I also explained on my talk page that I only use the optional colors when there is a reason.
- Be more rational, because I only edit the colors when it's absolutely necessary. Even if you were the one who created or mostly edited the template. Color options are there for a reason. When all the highs are in the late 20s and early 30s, they are difficult to see. I don't have to write that on all discussion pages. When the precipitation or rain is more than 200 per month, the color appears black or when its too little with the lows around 1, both colors look the same.
--Mahmudmasri (talk) 21:49, 23 February 2014 (UTC)
He also had the audacity to threaten me with a block, after making false claims against me when he was the one to make mass reverts and claim I do so! --Mahmudmasri (talk) 22:04, 23 February 2014 (UTC)
He is being very discouraging for to me expand and enhance climate sections after all I did. Climate charts in many articles are either non-existent or incomplete. Why is he allowed to arbitrarily enforce his opinions. If color options are unacceptable, why are they even an option? --Mahmudmasri (talk) 22:13, 23 February 2014 (UTC)
There are too many climate charts left vandalized and I took the time and effort to fix that, when he never notices them or cares to fix them, only cares to ruin my edits! --Mahmudmasri (talk) 22:15, 23 February 2014 (UTC)
- You wrote:
- " I only use the optional colors when there is a reason" - most of your changes is change on pastel or/and green.
- "Color options are there for a reason. When all the highs are in the late 20s and early 30s, they are difficult to see" and "When the precipitation or rain is more than 200 per month, the color appears black or when its too little with the lows around 1, both colors look the same" - this is your private opinion, other users may have a different opinion.
- "He also had the audacity to threaten me with a block" - yes, if you do not stop mass change colors [1] (despite requests)
- "making false claims against me" - no, you wrong. No false.
- "ruin my edits"? - this is joke? I restored standard colours and this is ruin your edits? you are 10 years or what?
- Again: to mass changes of colors (pastels, green) in the articles must be consensus. After discussion no consensus to use pastels and green colours. There is only a consensus to apply the violet instead blue in the code of weatherbox (mainly in "Average low" and "Record low" line). Your changes to the colors (pastels, green) were automatically withdrawn. I understand, one or three articles but dozens or hundreds is too much and must be consensus.
- What have you done? Reverted my edits. You change colors without consensus and change colors despite the opposition of another user, make reverts, break the WP:CYCLE (edit, revert = discuss). Such behavior is unacceptable. Subtropical-man talk
(en-2) 22:17, 23 February 2014 (UTC)
You are the one who initiated the cycle of reverts. Those are examples of articles I was the one who created their climate charts, then you claimed that you reverted me on mass color edits. Reverting what?! I created them!
Anyone can check their recent history! --Mahmudmasri (talk) 22:28, 23 February 2014 (UTC)
- Whether new or existing weatherbox, you enter not standard colors. Subtropical-man talk
(en-2) 22:38, 23 February 2014 (UTC)
- Whether new or existing weatherbox, you enter not standard colors. Subtropical-man talk
- Aha! So you have a problem with the optional colors. You should see if there were a consensus to just remove the optional colors from the template in order for them not to be used. I suggest you call for voting on the issue. --Mahmudmasri (talk) 22:44, 23 February 2014 (UTC)
- No, not need a consensus to remove the optional colors. Existence and usage are two different terms. You can delete the entire contents of the article because Wikipedia is open and free (anyone can change it) but this does not mean that you can do. Subtropical-man talk
(en-2) 22:49, 23 February 2014 (UTC)
- No, not need a consensus to remove the optional colors. Existence and usage are two different terms. You can delete the entire contents of the article because Wikipedia is open and free (anyone can change it) but this does not mean that you can do. Subtropical-man talk
- Aha! So you have a problem with the optional colors. You should see if there were a consensus to just remove the optional colors from the template in order for them not to be used. I suggest you call for voting on the issue. --Mahmudmasri (talk) 22:44, 23 February 2014 (UTC)
- (Existence and usage)? Why did you change the colors I chose when I created the charts I mentioned above? You are contradicting yourself. --Mahmudmasri (talk) 22:55, 23 February 2014 (UTC)
- You do not understand:
- does not matter whether you create a new or editing an existing, in both cases, you leaving behind not standard colors. When you create new articles you can not break the rules because there are new articles.
- if there any option, does not mean that you can use it if you break a rule or consensus. For another example: you can delete the entire contents of the article because Wikipedia is open and free (anyone can change it) but this does not mean that you can do.
- Subtropical-man talk
(en-2) 23:08, 23 February 2014 (UTC)
- You do not understand:
- (Existence and usage)? Why did you change the colors I chose when I created the charts I mentioned above? You are contradicting yourself. --Mahmudmasri (talk) 22:55, 23 February 2014 (UTC)
- Also, you breaks consensus. There is clear consensus (7:0:0) for "Red background, white text" to "Average High" temperature color. Usage pastels breaks consensus. Subtropical-man talk
(en-2) 22:33, 23 February 2014 (UTC)
To sum: according to you better colour is green and pastels, according to me better colour is pink and black ;) but this does not mean that you change half of Wikipedia to your colors (green and pastels) and I change half of Wikipedia to colors (pink and black) because we have a own opinion. I understand, one or three articles but dozens or hundreds is too much and must be consensus. Dot. Subtropical-man talk
(en-2) 23:00, 23 February 2014 (UTC)
Please, don't falsify another claims! I don't prefer colors. Anyone can check again the examples I mentioned, they all didn't use pastels! I don't have to repeat again that I haven't changed half of Wikipedia's articles. It's what you were doing, rather than doing productive contributions as I was checking and reverting vandalism or expanding climate charts, when you only cared to revert my edits claiming that I mass changed colors. You are the one who is being opinionated here and want to enforce it. --Mahmudmasri (talk) 23:10, 23 February 2014 (UTC)
- I have no words. You "don't prefer colors". Really? You uses green and/or pastels (repeat: AND/OR). I dont wrote that you "haven't changed half of Wikipedia's articles". I wrote to explain what's going on: "according to you better colour is green and pastels, according to me better colour is pink and black ;) but this does not mean that you change half of Wikipedia to your colors (green and/or pastels) and I change half of Wikipedia to colors (pink and black) because we have a own opinion". I want to explain to you that you can have your own opinion about which colors are better, you can use this colours in few articles BUT not in dozens or hundreds articles. To mass changes of colors (green and/or pastels) in the articles (or the introduction of this colors in new wetherboxes) must be consensus. After discussion no consensus to use green and/or pastels. Also, there is clear consensus (7:0:0) for "Red background, white text" to "Average High" temperature color. Usage pastels breaks consensus. There is only a consensus to apply the violet instead blue in the code of weatherbox (mainly in "Average low" and "Record low" line). Your changes to the colors (green and/or pastels ) were automatically withdrawn. I understand, one or few articles but dozens or hundreds is too much and must be consensus. Please do not yell and thought little. Subtropical-man talk
(en-2) 23:23, 23 February 2014 (UTC)
I have a busy life and I just presented your issue here for reference to others. I have no time for procrastination. WP:WINNING --Mahmudmasri (talk) 00:20, 24 February 2014 (UTC)
- I suggest discussing this on ANI since this is purely based on an incident between two users, that has occurred similarly in the past before. Ssbbplayer (talk) 17:20, 24 February 2014 (UTC)
MoS compliance
Please note that this template (apparently due to another template) uses hashes for listing sources, which is contrary to MOS:HASH. Toccata quarta (talk) 11:14, 11 March 2014 (UTC)
Use of Weather box in settlement articles
Discussion started at Wikipedia_talk:WikiProject_Cities#Weather_box on the use of this template in settlement articles. SilkTork ✔Tea time 16:25, 29 April 2014 (UTC)
Separate templates
User:Lieutenant of Melkor on a large scale move Weather box data from articles to separate templates in articles about American cities, for example: [2] -> [3]. To make changes on a large scale (changes in many articles) must to be discussion and consensus.
Also, description of the changes of new templates nothing says about move of data from articles, this is a falsification of the history of changes. It does not matter that user added some extra information (for example "Percent possible sunshine"), can not pretend to be the sole author of these data. In history of changes of templates, for example: [4], it clear show that User:Lieutenant of Melkor is the sole author of these data. This is stealing. Discuss (in Lieutenant of Melkor talk page) with this user did not resolves the problem. He believes that it is all ok. So,
- Must to be discussion and consensus to make changes on a large scale (changes in many articles), therefore, let's start discussion.
- If will be a consensus to separate templates, description of the changes of new templates must say about move of data from articles, and also better add the wikilink.
Subtropical-man talk
(en-2) 09:00, 25 May 2014 (UTC)
Descriptions of changes
- Unless these city articles are deleted (and that will never happen), no edit history is being lost by my creation of these templates. If you still do not understand that, there is nothing I or others can do and you shall be considered to be in clear violation of WP:IDHT. "My master, Annatar the Great, bids thee welcome!" 10:12, 25 May 2014 (UTC)
- I did not wrote "edit history is lost". The history of changes is falsified by you and you breaking the license of Wikipedia. One of the examples: history of changes clear show that User:Lieutenant of Melkor is the sole author of these data. Also - yes, you (Lieutenant of Melkor) shall be considered to be in clear violation of WP:IDHT. Please do not pretend that you do not know what's going on or you do not understand. If you copying/moving data from article you must have to write (for example: in description of the changes) where comes from the data, where comes from transferred/moved these data. Subtropical-man talk
(en-2) 11:10, 25 May 2014 (UTC)can not pretend to be the sole author of these data. In history of changes of templates, for example: [4], it clear show that User:Lieutenant of Melkor is the sole author of these data. This is stealing.
Yes you essentially wrote the "edit history is lost", or more precisely, "edit history ended in one thread". Tracing the edit history only requires a bit more work on the part of the reader, but it's still there to show NO CITY started with {{Weather box}} or the like as a transclusion.- I suggest you read WP:WINNING; you were taught the same exact lesson about three months ago in an above thread on the same discussion page. "My master, Annatar the Great, bids thee welcome!" 14:07, 25 May 2014 (UTC)
- No, term of "lost" is one, falsification of history of changes is different. You lose authors + falsification of history of changes (i.e history of changes clear show that User:Lieutenant of Melkor is the sole author of these data). The history of changes is falsified by you and you breaking the license of Wikipedia. I repeat: these are the two things: obstructing access to authors/history of changes and falsification of history of changes (i.e history of changes clear show that User:Lieutenant of Melkor is the sole author of these data). Do you understand this? or you need it draw with crayons?
- Just create a new weather templates with description of changes (with informations or/and wikilink to article from whose copied data). Simply. While you're doing all to show that you are the author. It does not matter that you can look for authors by this data in Wikipedia, if use copy/paste, please give source/authors in description of changes. Simply.
- I suggest you wait for the opinion of other users. Subtropical-man talk
(en-2) 14:48, 25 May 2014 (UTC)- User:Lieutenant of Melkor hasn't done anything wrong. If you look at Sydney or Toronto you can see that neither of them mentions who added the data. Also the actual Sydney weatherbox template and Toronto weatherbox template make any mention of who was involved with the data just the name of the person who created the template. The people who added the data would already be in the original articles. CBWeather, Talk, Seal meat for supper? 20:01, 25 May 2014 (UTC)
- In the past, I also was accused of violating the license and I also must respect this against my will but other users were right. I want to quote a very good citation: "The cut-and-paste copying removes the edit history, so the CC-licensing attribution requirement is violated". I do not care Sydney and few other, this must be done in accordance with the requirements of rules of Wikipedia and standards of Wikipedia and licensing of Wikipedia.
- It is important, for example: I'm author of very many weatherboxes in very many articles, I do not give rights to any uses method of "cut-and-paste" without information about author or source, according to the CC-licensing. Cut-and-paste - ok, but with information about authors or/and link to original page. One user create data and other user copy this and paste this to another page as own work? I think many other authors feel the same, even if only a portion of users - it excludes method of "cut-and-paste" without information about author (history of changes) or source (link). There's not even a need for further discussion on this topic, rules and licensing of Wikipedia is more important than the opinion by some users. You want use method of "cut-and-paste", please give source or authors or link in description of changes. Simply. Subtropical-man talk
(en-2) 20:35, 25 May 2014 (UTC) - Read also User_talk:CambridgeBayWeather#You_wrong. Subtropical-man talk
(en-2) 22:11, 25 May 2014 (UTC)- That's a different issue. In this case no material is deleted or removed. It just moves and a look at the history shows who did what. CBWeather, Talk, Seal meat for supper? 21:43, 25 May 2014 (UTC)
- How people can know whether this material is cut-copied from article or created as new by User:Lieutenant of Melkor? Looking at this history of changes, people can infer that the author of these data User:Lieutenant of Melkor, as the sole author. Why people must think that these data are
stolencopied from article, if nothing showing about this in template, talk page of template or the description of changes of template. Please, think a little. Subtropical-man talk
(en-2) 22:24, 25 May 2014 (UTC)
- How people can know whether this material is cut-copied from article or created as new by User:Lieutenant of Melkor? Looking at this history of changes, people can infer that the author of these data User:Lieutenant of Melkor, as the sole author. Why people must think that these data are
- Ok, enough of this. Read Wikipedia:Copy-paste#How about copying and pasting from one Wikipedia article to another? / Wikipedia:Copying within Wikipedia say:
- "you can copy parts of one Wikipedia article into another, but you must link to the source article in your edit summary. Original content contributed by users can be freely used if the original author is properly attributed. If you have copied text but forgotten to use the edit summary, this can be easily corrected: You can make a dummy edit by making an inconsequential change to the article—such as adding a blank line to the end of the article—and link to the source article in edit summary then. A note such as
"content copied from [[source article]] on 1 January 2012"works fine". - Topic is closed. Subtropical-man talk
(en-2) 22:03, 25 May 2014 (UTC)
- That's a different issue. In this case no material is deleted or removed. It just moves and a look at the history shows who did what. CBWeather, Talk, Seal meat for supper? 21:43, 25 May 2014 (UTC)
- User:Lieutenant of Melkor hasn't done anything wrong. If you look at Sydney or Toronto you can see that neither of them mentions who added the data. Also the actual Sydney weatherbox template and Toronto weatherbox template make any mention of who was involved with the data just the name of the person who created the template. The people who added the data would already be in the original articles. CBWeather, Talk, Seal meat for supper? 20:01, 25 May 2014 (UTC)
- I did not wrote "edit history is lost". The history of changes is falsified by you and you breaking the license of Wikipedia. One of the examples: history of changes clear show that User:Lieutenant of Melkor is the sole author of these data. Also - yes, you (Lieutenant of Melkor) shall be considered to be in clear violation of WP:IDHT. Please do not pretend that you do not know what's going on or you do not understand. If you copying/moving data from article you must have to write (for example: in description of the changes) where comes from the data, where comes from transferred/moved these data. Subtropical-man talk
Discussion about transfer data from articles to separate templates
The first case (about descriptions of changes) was discussed. Now we discuss the second case: transfer data from weatherboxes in articles to separate templates. Must to be discussion and consensus to make changes on a large scale (changes in many articles), therefore, let's start discussion. Subtropical-man talk
(en-2) 21:25, 25 May 2014 (UTC)
- No problem as it really is a minor change. The same data is still in the article but just in a different setup. CBWeather, Talk, Seal meat for supper? 21:43, 25 May 2014 (UTC)
- Yes, a minor change within one article but this case concerns changes on a large scale (changes in very many articles), must to be discussion and consensus - especially if exist the opposition. Formerly (for some years) were discussions about transfers various parts of the articles to a separate templates, were supporters and opponents. Subtropical-man talk
(en-2) 21:57, 25 May 2014 (UTC)
- Yes, a minor change within one article but this case concerns changes on a large scale (changes in very many articles), must to be discussion and consensus - especially if exist the opposition. Formerly (for some years) were discussions about transfers various parts of the articles to a separate templates, were supporters and opponents. Subtropical-man talk
Metric only?
I am transferring this template into Slovenian Wikipedia (our sandbox sl:Predloga:Weather box/peskovnik, sl:Module:Weather box, and testcase sl:Predloga:Podnebje Ljubljane/peskovnik) .
- Is there any possibility to display only metric part of the result?
- Input and output values in our wiki should also have decimal comma instead of dot.
I often transfer your templates and Lua modules into sl:, but this one is too big for me. Any advice?--Pinky sl (talk) 20:30, 26 August 2014 (UTC)
- @User:Pinky sl: Both requests are
 Done. I did not update the sandbox, but the main module, though. Keep that in mind when you will check out the testcases page that you pointed out.--Snaevar (talk) 13:02, 7 September 2014 (UTC)
Unnecessary bold format
I suggest that most of the bold formatting - everything except the table heading ("Climate data for ...") - should be removed, as it is not consistent with MOS:BOLD. Mitch Ames (talk) 09:03, 12 September 2014 (UTC)
% Humidity. When?
"% Humidity" seems imprecise to me. First of all, it's average humidity, so that should be made clear.
Next, and more importantly, relative humidity varies throughout the day, and average afternoon relative humidity is often significantly lower than average morning humidity. In fact, diurnal variations in humidity are generally much more pronounced than variations in average humidity throughout the year.
- For instance, New Orleans, a very humid place, has the following humidity averages [5]. The average morning relative humidity varies from 84% in February to 92% in August, a variation of only 8%. The average afternoon relative humidity there ranges from 59% in April or October to 66% in Jan/Jul/Dec, a variation of only 7%. But the average diurnal variation in humidity is 25% (88% to 63%).
- Looking at a drier location like Dallas, the same trend holds: morning humidity varies 7% throughout the year (80-87%), afternoon humidity by 11% (49-60%), with an average diurnal variation of 26% (56-82%).
- Okay, both of those are in Humid Subtropical climates, without a pronounced dry season. What about San Francisco (SFO)? Only 5% variation in morning humidity throughout the year, 8% in the afternoons, but an average diurnal variation of 22%.
For these cities and many others, it’s not particularly informative showing a monthly humidity, especially if we don’t specify when in the day the humidity reading was taken. For this reason, it’s important to specify what time of day these readings were taken when this information is specified in the source.
Third, when people talk about humidity, it is much more often in the context of heat and the heat index, so afternoon humidity is much more relevant. Rarely are people interested in calculating the heat index at the coolest time of the day; they are usually concerned with how hot it will feel at the hottest part of the day. On the drier side, fire weather warnings are typically issued based on the minimum relative humidity that will be reached during the afternoon.
Fourth, for the above example cities and especially for drier locations, the difference in afternoon humidity is more pronounced throughout the year than the month-to-month variation in morning humidity. Take Salt Lake City. Mornings vary from 79% in January to 52% in July: 27%. Afternoons, 70% in January to 22% in July: 48%. And keep in mind that % relative humidity varies much less per degree increase in temperature at a constant dewpoint. (Raising the temperature from 70F to 80F at constant 70F dewpoint drops the RH from 100% to 72%: a 28% drop; from 70F to 80F at constant 20F dewpoint drops the RH 15% to 11%: only a 4% difference.[ http://andrew.rsmas.miami.edu/bmcnoldy/Humidity.html]) So a greater difference relative humidity in the drier part of the day (afternoons in January vs. July) is representative of a much larger temperature/dewpoint separation difference than would the same %RH difference in the mornings. For this reason, it is more important to list average afternoon relative humidities when this information is specified in the source.
I propose changing the existing “% humidity” to “Average Relative humidity (%)”. Note the different wikilink, which would link to the more appropriate page. I’ll do this right away. There’s no category currently in the template for dewpoint, and I can’t remember seeing this in any articles so far, so I don’t think this will make any difference in existing articles. If it does, it’s high time for the issue to come up, because that means that some editors were entering in dewpoints when RHs were implied by this template.
I propose adding a category for “Average Afternoon Relative humidity (%)”. The reason for the second category: I’m not confident that the sources for climate data for all cities, especially outside the United States, state what time of the day the humidity readings were taken. I’m pretty sure I would be able to tell if the data represents average throughout the day or average afternoons, but I’m not sure yet if this would run into issues of WP:SYN or WP:OR.
Ufwuct (talk) 21:50, 25 March 2015 (UTC)
Row Headings
I think the new row headings are incorrect/misleading for precipitation and snow by not being clear that the listings are for monthly averages. Is there an easy way to fix/modify these row headings? DBK (talk) 21:28, 3 April 2015 (UTC)
- User:DBK, Do you mean like this? CambridgeBayWeather, Uqaqtuq (talk), Sunasuttuq 21:39, 5 April 2015 (UTC)
- Uqaqtuq (talk), Ha, yes, yours seems to have the labels correct and the annuals correct (at least in terms of not adding additional decimal places. I will have to check yours out more thoroughly -- can I use only the rows for which I have data? I do have average snow depth info, by month, that I'd like to use and that seems to create its own problems. Thank you. DBK (talk) 01:47, 6 April 2015 (UTC)
- The one in my sandbox, like a lot of Canadian ones, has mean/average snow depth available. The Wikipedia template however, will not accept the mean snow depth. It comes down to how much stuff can be put into the template, probably as much as you want, compared to how much information is useful. Even I, who does weather observations for a living, realises that there is a limit to what the reader will find useful. CambridgeBayWeather, Uqaqtuq (talk), Sunasuttuq 02:34, 7 April 2015 (UTC)
Tweaks and corrections
As per the above two sections I've tweaked the template. I added the option to have the time of day the humidity was measured at by using "|time day =" or if the humidity is for the entire day then "|daily = Y" should be used. I've also removed the piping in Average [[Relative humidity|humidity]] to Average [[relative humidity]] for clarity.
I also added "Average" to the snow rain and precipitation lines.
I removed "Average high temperature during the day (average maximum daytime temperature)" and "Average low temperature at night (average minimum night-time temperature)". The wording is meaningless as day and night have not been defined. Also that does not apply to every country. As an example Canada, click to open the temperature section, says "At most climatological stations, maximum temperature is the highest temperature recorded in a 24-hour period..." and this is usually 0600Z which is close to midnight local. This is completely different to the undefined day and night given above. I tried checking the US and UK but couldn't find anything. For Australia it says "Maximum and minimum temperatures for the previous 24 hours are nominally recorded at 9 am local clock time." Does anyone know the country/countries in which the day/night temperatures applied. CambridgeBayWeather, Uqaqtuq (talk), Sunasuttuq 05:04, 7 April 2015 (UTC)
- The US is a mixture of practices depending on the type and history of the weather station. Most of the modern weather stations at airports records max / min based on 24-hour intervals that run from local midnight-to-midnight; however, there are still many less modern sites (particularly rural ones) whose climatological day is measured in the morning and typically runs from local 6 AM-to-6 AM. Back in the early to middle 20th century the dominant US practice was actually to use an afternoon climatological day and recordings ran from roughly local 6 PM-to-6 PM or 8 PM-to-8 PM. There is still a dwindling subpopulation of US weather stations that use this afternoon recording practice. (In the literature, these variations introduce what is known as time-of-observation bias.) Though major airports are pretty reliably midnight-to-midnight in the US, one would have to dig into the details to figure out the recording practice at most other US sites. Dragons flight (talk) 05:29, 7 April 2015 (UTC)
- Thanks. It's still done over a 24 hour period though and means the comments in the template did not apply to the US either. I think it's impossible to put in anything to indicate when a station is is taking the max and min readings. As an example at 24 hour station like Cambridge Bay Airport we record the max and min at 06Z, 12Z, 18Z and 00Z and the day is taken from the 06Z. However, a part time station like Ulukhaktok/Holman Airport would be read twice. Once at 15Z (on opening) and again at 01Z (Mon-Sat) and 20Z (Sun). CambridgeBayWeather, Uqaqtuq (talk), Sunasuttuq 07:40, 7 April 2015 (UTC)
- I would agree with removing that term given the climatological day is not defined uniformly across locations. Not all national meteorological services for each country can define a climatological day as good as Canada and USA so its better to avoid using the term "day". It makes more sense to most readers. I think we should also define the wind chill field as the record low, similar to how the humidex is defined as record high. Ssbbplayer (talk) 12:44, 7 April 2015 (UTC)
- Good idea. I added that in. CambridgeBayWeather, Uqaqtuq (talk), Sunasuttuq 21:48, 7 April 2015 (UTC)
- Weather forecasts in world (TV, radio, internet - for example) show data/temperatures for day (maximum) and night (minimum). Wikipedia is for people, not for meteorologists. People do not know what is "Average high" or "Average low" and often confuse with temperature records. Should be a description (yon or another) of what exactly is "Average high" and "Average low", that even a layman knows what's going on. Subtropical-man talk
(en-2) 22:25, 7 April 2015 (UTC)
- Weather forecasts in world (TV, radio, internet - for example) show data/temperatures for day (maximum) and night (minimum). Wikipedia is for people, not for meteorologists. People do not know what is "Average high" or "Average low" and often confuse with temperature records. Should be a description (yon or another) of what exactly is "Average high" and "Average low", that even a layman knows what's going on. Subtropical-man talk
- I don't speak Polish which makes the link difficult to understand. I take it you are talking about the forecast overnight lows and daytime high. However, the template is not showing forecasts. What the template should be showing is a 30 year average of the high temperatures and low temperatures. Of course not every place does that as some don't have enough data for the 30 years and some use all the data they have. However, none of them show what the time of day was when the temperature was recorded. Thus the maximum (or minimum) could have been recorded at any time during the 24 period. Sometimes the high will be recorded during what might be termed night and the low during what might be termed day. As an example, last December 16 the lowest of the 24 hour period was recorded between 8 and 9 am. On July 12 the highest was recorded between 7 and 8 pm. Given that putting the hidden remarks is just wrong. Would "Average monthly highs" and "Average monthly lows" work? CambridgeBayWeather, Uqaqtuq (talk), Sunasuttuq 02:22, 8 April 2015 (UTC)
- What you write does not matter. 4am or 7am (for low temperatures) or 1pm or 2pm (for high temperatures) - does not matter, always presents informations about daily the minimum and maximum temperature. Moreover - you're wrong, because the coldest daily temperature is always at night just before sunrise, the hour of sunrise is different depending on the month. For example: in London - 21 December sunrise is 8:04am, 21 June sunrise is 4:44am; in Los Angeles - 21 December sunrise is 6:55am, 21 June is 5:43am. So, 5am or 8am - does not matter, no matter what daily hour is the coldest or warmest - in template is valid only and exclusively the temperature, without a date, hours or season. Subtropical-man talk
(en-2) 17:56, 8 April 2015 (UTC)
- What you write does not matter. 4am or 7am (for low temperatures) or 1pm or 2pm (for high temperatures) - does not matter, always presents informations about daily the minimum and maximum temperature. Moreover - you're wrong, because the coldest daily temperature is always at night just before sunrise, the hour of sunrise is different depending on the month. For example: in London - 21 December sunrise is 8:04am, 21 June sunrise is 4:44am; in Los Angeles - 21 December sunrise is 6:55am, 21 June is 5:43am. So, 5am or 8am - does not matter, no matter what daily hour is the coldest or warmest - in template is valid only and exclusively the temperature, without a date, hours or season. Subtropical-man talk
- I don't speak Polish which makes the link difficult to understand. I take it you are talking about the forecast overnight lows and daytime high. However, the template is not showing forecasts. What the template should be showing is a 30 year average of the high temperatures and low temperatures. Of course not every place does that as some don't have enough data for the 30 years and some use all the data they have. However, none of them show what the time of day was when the temperature was recorded. Thus the maximum (or minimum) could have been recorded at any time during the 24 period. Sometimes the high will be recorded during what might be termed night and the low during what might be termed day. As an example, last December 16 the lowest of the 24 hour period was recorded between 8 and 9 am. On July 12 the highest was recorded between 7 and 8 pm. Given that putting the hidden remarks is just wrong. Would "Average monthly highs" and "Average monthly lows" work? CambridgeBayWeather, Uqaqtuq (talk), Sunasuttuq 02:22, 8 April 2015 (UTC)
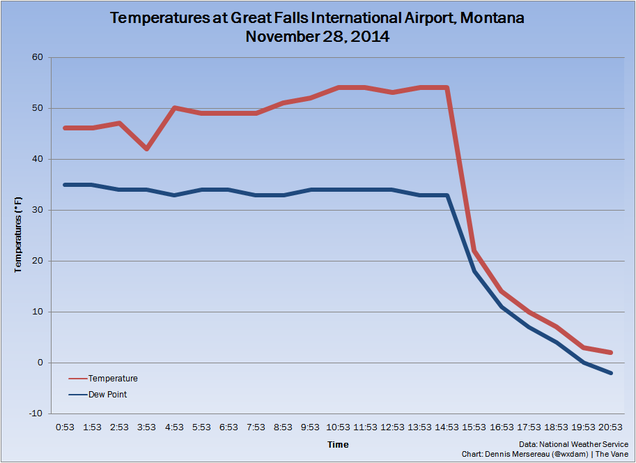
- Typically, the coldest part of the day is before sunrise and the warmest is mid afternoon. However, weather is more than just averages. On any given day, a warm front or cold front can cause large changes in temperature. For example, on this day in Montana, 6 PM was 40 degrees Fahrenheit colder than 6 AM. Though unusual, there is no strict guarantee that the warmest time occurred during daylight or the coldest at night. Dragons flight (talk) 18:17, 8 April 2015 (UTC)
- The coldest day temperature is not always at night just before sunrise. Here you can see that the coldest temperature of the day was recorded at noon, not just before sunrise. The warmest temperature was recorded at 11:00 pm. So "Average low temperature at night (average minimum night-time temperature)" really does not apply and would be misleading. The idea that it is coldest just before sunrise sounds very similar to the phrase "the darkest hour is just before the dawn" and that isn't true either. The temperature that day was driven by cloud cover. There was more cloud cover at 11 pm that there was at noon. CambridgeBayWeather, Uqaqtuq (talk), Sunasuttuq 12:39, 11 April 2015 (UTC)
- These examples are sufficient enough to show that the warmest temperature is not necessary during the day and the coldest temperature is not always at night before sunrise. I did updated Template:Weather box/doc for these recent changes. Ssbbplayer (talk) 13:39, 16 April 2015 (UTC)
- The coldest day temperature is not always at night just before sunrise. Here you can see that the coldest temperature of the day was recorded at noon, not just before sunrise. The warmest temperature was recorded at 11:00 pm. So "Average low temperature at night (average minimum night-time temperature)" really does not apply and would be misleading. The idea that it is coldest just before sunrise sounds very similar to the phrase "the darkest hour is just before the dawn" and that isn't true either. The temperature that day was driven by cloud cover. There was more cloud cover at 11 pm that there was at noon. CambridgeBayWeather, Uqaqtuq (talk), Sunasuttuq 12:39, 11 April 2015 (UTC)
Source italics
The template shout not put the output of |source 1= and |source 2= in italics. If the source cites a work that should be italicised following MOS:ITALIC, it should be formatted the usual way in the source code. -- Michael Bednarek (talk) 02:39, 31 May 2015 (UTC)
- Now implemented at sandbox and shown at testcases. -- Michael Bednarek (talk) 10:49, 6 June 2015 (UTC)
Width
The width of the template was just reduced. I've reverted it for now as I think there needs to be a discussion before making a major change like. Of course this comes down to how people think the box looks. I don't think the small size improves the readability at all. It doesn't seem to help much on a phone nor on a larger screen. If the box is too wide for the page because of other factors, Chesterfield Inlet, Nunavut, then <div style=width:80%> can be used to set a size. CambridgeBayWeather, Uqaqtuq (talk), Sunasuttuq 02:24, 19 June 2015 (UTC)
- Yesterday I discovered the as-yet-undocumented "width=auto" parameter (e.g., as I just implemented it in the Chiang Mai article), which automatically adjusts the width of the table to fit the article, though IMHO it makes the default width a bit to small. I find this to be more useful than <div style=width:nn%>, as a fixed percentage is not always applicable to every browser window width—as the width of the window changes, infoboxes, images, etc., are rearranged, and what was a good ratio at one width becomes a poor one at another. I'd like to keep the "width=auto" parameter, but make the default width greater. Unfortunately, the template syntax is too complex for me—would someone please be so kind as to do this?—DocWatson42 (talk) 03:56, 31 August 2015 (UTC)
Problem with mm to inches conversion
Hi, the weather box at Rishon_LeZion#Geography is incorrectly converting mm to inches in the precipitation row. Can anyone see why? Zerotalk 01:25, 5 October 2015 (UTC)
- Yes. I know the problem. In that weather box, you have parameters for inches that are being entered in. For example, in the editing window, I saw "|Jan precipitation inch=5.5" in there. As such, the weather box will the 5.5 inches in January, overriding the automatic conversion. To fix it, simply remove the parameters related to inches and the template will correctly convert it for you. Normally, if you enter in the metric units, the template will convert it to imperial units, so you don't need to manually convert it by adding in the parameters for the imperial units (eg. "|Jan precipitation inch="). See the 2 differences here (after removing the inches field/letting it convert and before). As you can see the conversion is now correct. Hope that helps. Ssbbplayer (talk) 00:53, 10 October 2015 (UTC)
Average high and low
This was raised once before, but nothing was ever resolved, as far as I know. The problem is with the the per-month "Average high" and "Average low" temperature data that appears in numerous of these weather boxes. "Average high" could mean (i) the maximum temperature attained over the whole month, averaged over the years, or (ii) the average daily maximum for days in that month. Similarly for the lows. There is obviously a big difference in those two numbers, and unless it is clear which is meant the data is essentially meaningless. I suspect that (ii) is meant, but this would need to be verified. If this is correct, changing the labels to "Average daily high" and "Average daily low" would fix the problem. 81.152.224.68 (talk) 02:47, 13 August 2015 (UTC)
- (ii) is the correct term and this is what most people would think off as well. Unfortunately, even this issue extends to analyzing WMO CLINO data as well where some countries use different terms for the average high for the same thing. I think changing it to your suggestions is better as the mean/average temperature has this field and would clarify any misunderstandings. Ssbbplayer (talk) 03:54, 10 October 2015 (UTC)
Converting to Kelvin
I'm working on my own version for my own use. I'm not an American so I don't use the imperial system. I attempted to change the conversion so it is C-K and K-C. It still converts to F though and I cannot figure out where the conversion is taking place. I was expecting something like {{convert|10|C|F}} (but with a variable rarther than a number). So what is being used to convert the temperatures? Davidbuddy9 (talk) 15:46, 24 April 2015 (UTC)
Module:WeatherBox, reconcileTemperature
The key conversion occurs in the Lua Module WeatherBox, which has the explicit mathematical equations in function reconcileTemperature. currently on line 316 of the source code. There will be other places to find the display labels and such. Iowajason (talk) 15:09, 15 November 2015 (UTC)
Precipitation Colour
I know this discussion has been brought up before but I believe there needs to be a definitive decision made on precipitation colour in weather boxes. I have been leaving precipitation as the default blue when I update or add weather boxes to pages but more often than not someone else will come along and change precipitation to green. I have been told that green makes the text easier to read but I believe blue is a better choice for a number of reasons. Firstly, blue makes sense in the context of rain and precipitation in general while green appears out of place both in its context and when viewed beside other colours in the weather box. Secondly, only some rows are being changed to green, leaving other rows with the previous blue colour scheme. For example, the rainy days field will remain blue after the surrounding rainfall and relative humidity fields have been changed to the green colour scheme. This leaves the chart messy and inconsistent and surely only creates further confusion over the accepted colour scheme. I also believe that when using the blue gradient it is easier to differentiate between cells with similar precipitation levels than it is when using the green gradient, allowing for a more easily understandable picture of weather patterns throughout the year at a glance. In response to any concerns over the readability of blue cells, I think the black on orange of temperatures in the high 30s is far more difficult to discern than black on light blue, not to mention the readability issues that also exist with white text on certain shades of green. If readability remains a significant concern, a possible solution could be to lower the threshold for the switch to white text.
Overall, I believe there definitely needs to be a consensus reached on precipitation colour in weather boxes, as there is no reason for multiple colours to exist for the same purpose. I have listed a number of reasons above that explain why I believe blue would be a better choice (context, contrast, consistency) but if others are able to provide good arguments in favour of green then it should at least be implemented properly. Either way, the colour of cells should not be left to a single user to decide and a default should be agreed to and subsequently not changed without discussion. Blue is currently the default as set in the template so I think it would be best if this is left unchanged on pages either until it is agreed that it should stay as default or until the default is changed to green. Changing to green now will either be a pointless move if the default colour is changed or necessitate many further edits to revert it if blue becomes the consensus.
Svwiki99 (talk) 06:58, 13 December 2015 (UTC)
- I think for green, the white value can be lowered to around 150 mm so one way would to darken the green colour a bit (others have voiced concerns that it is a tad too bright). I think the white text at 90 mm for the blue scheme is too low and is biased to making the climate appear wetter than it should be. I normally prefer green as it allows better differentiation between the cells for rainy/snowy/precipitation days, humidity and record lows than blue. It also has a better gradient than blue as the blue colour's gradient is too strong at the beginning (looks strong already at 90 mm compared to around 180 mm for green) and too little at the upper values (looks black which doesn't make sense) compared to green which has a more even gradient. However, both of them have very poor gradients at the 120-160 mm range as they often look similar. Normally, I prefer keeping the humidity and precip/snowy/rainy days blue since using the green colours for these cells is very bad at differentiating between different values (as it uses the same gradient as precipitation). Green is used since rainfall does make the vegetation green in most places outside of the polar zones. I prefer it due to providing better contrast between the different fields, having a more even gradient and since it plays a key role in making deciding the type of vegetation (a deeper green usually means thicker vegetation).
- I think the best solution would to be 1) darken the green colour a bit and lower the white value to 150 mm, 2) lighten the blue colour scheme to differentiate it from the rainy/humidity cells and move the white text up to 150 mm (I really dislike the navy blue scheme and prefer a more lighter form) although I am no expert in knowing how to do it. The default blue scheme is flawed and needs improvements in it. For now, there should be no mass changes in the colour of weatherboxes (either to blue or to green) to avoid any further controversies. Ssbbplayer (talk) 17:22, 13 December 2015 (UTC)
Seems like error in |temperature colour=none
On the rainfall lines start off with white (maybe). but starts blue after a few months. Or maybe when rain is more than 100mm a month. see Climate of the Philippines. 194.75.238.182 (talk) 22:42, 17 February 2016 (UTC)
- Temperature colour of course only reflects temperature and not any other element--2A02:C7F:C802:4000:8CF6:9797:8453:9343 (talk) 00:42, 30 May 2016 (BST)
GENIUS IDEA
Let's have two extra rows: average MONTHLY absolute maximum temperature, and average MONTHLY absolute minimum tempreature, placed under Record high and above record low, respectively — Preceding unsigned comment added by Koopatrev (talk • contribs) 05:12, 15 March 2016
- I'm not sure that is a good idea. What countries show that data? CambridgeBayWeather, Uqaqtuq (talk), Sunasuttuq 10:39, 15 March 2016 (UTC)
- Hong Kong does, i mean most countries don't do that but if they don't we can just leave it blank. I manually calculated here: http://www.hko.gov.hk/cis/monthlyElement_e.htm?ele=MAX_TEMP @CambridgeBayWeather: Koopatrev (talk) 03:30, 18 March 2016 (UTC)
- Well I not really convinced but I'm not really opposed either. And I see that nobody has removed your additions anyway. CambridgeBayWeather, Uqaqtuq (talk), Sunasuttuq 16:29, 18 March 2016 (UTC)
- Hong Kong does, i mean most countries don't do that but if they don't we can just leave it blank. I manually calculated here: http://www.hko.gov.hk/cis/monthlyElement_e.htm?ele=MAX_TEMP @CambridgeBayWeather: Koopatrev (talk) 03:30, 18 March 2016 (UTC)
temporal range norms
I seem to notice (just from looking at a few, not a systematic sample) that most US weather boxes currently provide statistics for weather over 1981-2010. I'm thinking, given that
- the norm for presenting statistics over 30 recent years seems reasonable
- we're now well into 2016, so 2015 data is available
- there is climate change
weatherboxes should start providing data over the temporal range 1986-2015. Am I missing something? Tlroche (talk) 00:49, 18 March 2016 (UTC)
- It's a 30 year mean for climate standards. The US, like other counties, provide the 30 year means/averages along with record highs and lows since the particular station was in operation in accordance to the World Meteorological Organization. For example here is the Cambridge Bay data where the means are over a 30 year period and the extremes in temperature date back to 1930. According to the WMO, who define the standards in the last paragraph. So the next period starts 10 years after the last and is 1991-2020.
- To go to a 1986-2015 period would mean a lot of work. You would need to get 30 years worth of data for each station and then calculate the means. Too much chance for error. Also it would mean that Wikipedia is not showing the world standard information leading to claims of original research. Much better, and easier, to follow the WMO standards where we only have to repeat what the government of the country has produced. CambridgeBayWeather, Uqaqtuq (talk), Sunasuttuq 16:29, 18 March 2016 (UTC)
howto?
Is there a weatherbox howto? Or just a detailed example showing how to produce a weatherbox (using this template) for a given geography's wikipage ab initio? What I mean, why I ask (hopefully without WTMI):
- I have an interest in some particular US geographies and in humidity. I notice that the Phoenix weather box has a row for average relative humidity, which I'd like to add to the weatherboxes on a few other pages.
- I have some experience with met/climate data, with some available API and with brute-force scarping where API are not available.
- I'm a coder, and I run Linux, so I'm reasonably confident I can run most scientific codes. (Plus I see you have the online sandbox for the Lua module=WeatherBox.)
Hence I'd like to contribute to Wikipedia (for which I also edit and author other content) by updating (e.g., with newer temporal ranges) or extending some weatherboxes (at least those of particular current interest to me :-). However I can't see how to do this. I see the Lua module, and I see that the source for most US weatherbox data is NOAA NOWData, but I see nothing about, e.g., how to input the data to the module.
Am I missing something? If not, can someone who has previously done a weatherbox generate a quick/skeletal weatherbox howto? I would cheerfully work through it and "flesh it out," but I can't see where/how to start. Tlroche (talk) 00:49, 18 March 2016 (UTC)
- Not absolutely sure what you mean but here is what I do. In this case I'm going to update the Beaver Mines article so I would copy the necessary table and paste into a text editor, metric version, from the Template:Weather box page like this:
| Collapsed for readability |
|---|
| The following discussion has been closed. Please do not modify it. |
{{Weather box     <!-- Infobox begins -->
| collapsed    =  <!-- Any entry in this line will make the template initially collapsed. Leave blank or remove this line for uncollapsed. -->
| open         =  <!-- Any entry in this line will make the template permanently open, and remove the hide button. Remove this line for a collapsable table. -->
| metric first = yes
| single line  =  <!-- Any entry in this line will display metric and imperial units in the same cell. Leave blank or remove this line for separate table rows. -->
| location     =  <!-- Mandatory field, location the climate data was taken, usually an airport. -->

| temperature colour =  <!-- Enter "pastel" for pastel temperature colors, "none" for no colours, remove this line for the standard coloring. -->
<!-- Maximum Humidex -->
<!-- The humidex table can be used only if the source provides humidex values. As of July 2015, few if any countries other than Canada use the Humidex. -->
| Jan maximum humidex  =
| Feb maximum humidex  =
| Mar maximum humidex  =
| Apr maximum humidex  =
| May maximum humidex  =
| Jun maximum humidex  =
| Jul maximum humidex  =
| Aug maximum humidex  =
| Sep maximum humidex  =
| Oct maximum humidex  =
| Nov maximum humidex  =
| Dec maximum humidex  =
| year maximum humidex =
<!-- Record high temperatures -->
<!-- Note that record temperatures should be used sparingly in main city articles, and should only be used when the data period is of the greatest length possible. -->
| Jan record high C =
| Feb record high C =
| Mar record high C =
| Apr record high C =
| May record high C =
| Jun record high C =
| Jul record high C =
| Aug record high C =
| Sep record high C =
| Oct record high C =
| Nov record high C =
| Dec record high C =
<!-- Average high temperatures -->
| Jan high C  =
| Feb high C  =
| Mar high C  =
| Apr high C  =
| May high C  =
| Jun high C  =
| Jul high C  =
| Aug high C  =
| Sep high C  =
| Oct high C  =
| Nov high C  =
| Dec high C  =
| year high C =
<!-- Mean daily temperature -->
| Jan mean C  =
| Feb mean C  =
| Mar mean C  =
| Apr mean C  =
| May mean C  =
| Jun mean C  =
| Jul mean C  =
| Aug mean C  =
| Sep mean C  =
| Oct mean C  =
| Nov mean C  =
| Dec mean C  =
| year mean C =
<!-- Average low temperatures -->
| Jan low C  =
| Feb low C  =
| Mar low C  =
| Apr low C  =
| May low C  =
| Jun low C  =
| Jul low C  =
| Aug low C  =
| Sep low C  =
| Oct low C  =
| Nov low C  =
| Dec low C  =
| year low C =
<!-- Record low temperatures -->
<!-- Note that record temperatures should be used sparingly in main city articles, and should only be used when the data period is of the greatest length possible. -->
| Jan record low C =
| Feb record low C =
| Mar record low C =
| Apr record low C =
| May record low C =
| Jun record low C =
| Jul record low C =
| Aug record low C =
| Sep record low C =
| Oct record low C =
| Nov record low C =
| Dec record low C =
<!-- Minimum wind chill -->
| Jan chill  =
| Feb chill  =
| Mar chill  =
| Apr chill  =
| May chill  =
| Jun chill  =
| Jul chill  =
| Aug chill  =
| Sep chill  =
| Oct chill  =
| Nov chill  =
| Dec chill  =
| year chill =
<!-- Total precipitation, this should include rain and snow. -->
| precipitation colour  =  <!-- Enter "green" for green precipitation colours, "none" for no colours, remove this line for blue colouring. -->
<!-- IMPORTANT: use mm or cm but NOT both! -->
| Jan precipitation mm  =
| Feb precipitation mm  =
| Mar precipitation mm  =
| Apr precipitation mm  =
| May precipitation mm  =
| Jun precipitation mm  =
| Jul precipitation mm  =
| Aug precipitation mm  =
| Sep precipitation mm  =
| Oct precipitation mm  =
| Nov precipitation mm  =
| Dec precipitation mm  =
| year precipitation mm =

| Jan precipitation cm  =
| Feb precipitation cm  =
| Mar precipitation cm  =
| Apr precipitation cm  =
| May precipitation cm  =
| Jun precipitation cm  =
| Jul precipitation cm  =
| Aug precipitation cm  =
| Sep precipitation cm  =
| Oct precipitation cm  =
| Nov precipitation cm  =
| Dec precipitation cm  =
| year precipitation cm =

<!-- Rainfall -->
| rain colour  =  <!-- Enter "green" for green rainfall colours, "none" for no colours, remove this line for blue colouring. -->
<!-- IMPORTANT: use mm or cm but NOT both! -->
| Jan rain mm  =
| Feb rain mm  =
| Mar rain mm  =
| Apr rain mm  =
| May rain mm  =
| Jun rain mm  =
| Jul rain mm  =
| Aug rain mm  =
| Sep rain mm  =
| Oct rain mm  =
| Nov rain mm  =
| Dec rain mm  =
| year rain mm =

| Jan rain cm  =
| Feb rain cm  =
| Mar rain cm  =
| Apr rain cm  =
| May rain cm  =
| Jun rain cm  =
| Jul rain cm  =
| Aug rain cm  =
| Sep rain cm  =
| Oct rain cm  =
| Nov rain cm  =
| Dec rain cm  =
| year rain cm =

<!-- Snowfall -->
<!-- IMPORTANT: use mm or cm but NOT both! -->
<!-- IMPORTANT: Do NOT use snow depth information in the snowfall area! These are 2 different kinds of data! -->
| snow colour  =  <!-- Enter "green" for green snowfall colors, "none" for no colours, remove this line for blue coloring. -->
| Jan snow mm  =
| Feb snow mm  =
| Mar snow mm  =
| Apr snow mm  =
| May snow mm  =
| Jun snow mm  =
| Jul snow mm  =
| Aug snow mm  =
| Sep snow mm  =
| Oct snow mm  =
| Nov snow mm  =
| Dec snow mm  =
| year snow mm =

| Jan snow cm  =
| Feb snow cm  =
| Mar snow cm  =
| Apr snow cm  =
| May snow cm  =
| Jun snow cm  =
| Jul snow cm  =
| Aug snow cm  =
| Sep snow cm  =
| Oct snow cm  =
| Nov snow cm  =
| Dec snow cm  =
| year snow cm =

<!-- Average daily % humidity -->
<!-- If entering the average daily % humidity, then the humidex table should be used. As of December 2009, few if any countries other than Canada use the Humidex. -->
| humidity colour =  <!-- Enter "green" for green humidity colors, "pastel" for pastel humidity colours, "none" for no colours, remove this line for blue coloring. -->
| time day        =  <!-- The time of day the humidity was measured at.-->
| daily           =  <!-- Enter "Y" if the humidity is for the entire day-->
| Jan humidity    =
| Feb humidity    =
| Mar humidity    =
| Apr humidity    =
| May humidity    =
| Jun humidity    =
| Jul humidity    =
| Aug humidity    =
| Sep humidity    =
| Oct humidity    =
| Nov humidity    =
| Dec humidity    =
| year humidity   =
<!-- Average number of precipitation days -->
| unit precipitation days =  <!-- If entering the average number of days, then the unit requirement should be used, because this varies between countries. E.g. 0.2 cm, 0.2 mm. -->
| precip days colour      =  <!-- Enter "green" for green colors, "pastel" for pastel colours, "none" for no colours, remove this line for blue coloring. Affects rain and snow days as well -->
| Jan precipitation days  =
| Feb precipitation days  =
| Mar precipitation days  =
| Apr precipitation days  =
| May precipitation days  =
| Jun precipitation days  =
| Jul precipitation days  =
| Aug precipitation days  =
| Sep precipitation days  =
| Oct precipitation days  =
| Nov precipitation days  =
| Dec precipitation days  =
| year precipitation days =
<!-- Average number of rainy days -->
| unit rain days =  <!-- If entering the average number of days, then the unit requirement should be used, because this varies between countries. E.g. 0.2 cm, 0.2 mm. -->
| Jan rain days  =
| Feb rain days  =
| Mar rain days  =
| Apr rain days  =
| May rain days  =
| Jun rain days  =
| Jul rain days  =
| Aug rain days  =
| Sep rain days  =
| Oct rain days  =
| Nov rain days  =
| Dec rain days  =
| year rain days =
<!-- Average number of snowy days -->
| unit snow days =  <!-- If entering the average number of days, then the unit requirement should be used, because this varies between countries. E.g. 0.2 cm, 0.2 mm. -->
| Jan snow days  =
| Feb snow days  =
| Mar snow days  =
| Apr snow days  =
| May snow days  =
| Jun snow days  =
| Jul snow days  =
| Aug snow days  =
| Sep snow days  =
| Oct snow days  =
| Nov snow days  =
| Dec snow days  =
| year snow days =
<!-- Average monthly sunshine hours, monthly totals are preferred, and will produce colours, but percentages are accepted. Use either the monthly or daily sunshine (depending on the source) but not both. -->
| Jan sun  =
| Feb sun  =  <!-- For February only if the source gives daily hours, please multiply by 28.25, not 28 -->
| Mar sun  =
| Apr sun  =
| May sun  =
| Jun sun  =
| Jul sun  =
| Aug sun  =
| Sep sun  =
| Oct sun  =
| Nov sun  =
| Dec sun  =
| year sun =
<!-- Average daily sunshine hours. Use either the monthly or daily sunshine (depending on the source) but not both. -->
| Jand sun  =
| Febd sun  =
| Mard sun  =
| Aprd sun  =
| Mayd sun  =
| Jund sun  =
| Juld sun  =
| Augd sun  =
| Sepd sun  =
| Octd sun  =
| Novd sun  =
| Decd sun  =
| yeard sun =
<!-- Average percent of possible sunshine. Number of daylight hours already factored into this number. Note that since this is possible sunshine, nighttime hours should not be included in this calculation. Will produce colors. -->
| Jan percentsun  =
| Feb percentsun  =
| Mar percentsun  =
| Apr percentsun  =
| May percentsun  =
| Jun percentsun  =
| Jul percentsun  =
| Aug percentsun  =
| Sep percentsun  =
| Oct percentsun  =
| Nov percentsun  =
| Dec percentsun  =
| year percentsun =
<!-- Mandatory fields, source -->
| source = <ref name="">{{cite web |url= |title= |publisher= |access-date=March 15, 2016 }}</ref>
<!-- For a second source -->
| source 2 = <ref name="">{{cite web |url= |title= |publisher= |access-date=March 15, 2016 }}</ref>
}}<!-- Infobox ends -->
Then based on the available data I would remove all the fields that didn't require. Like so: {{Weather box
| metric first = yes
| single line = yes
| location =
| Jan record high C =
| Feb record high C =
| Mar record high C =
| Apr record high C =
| May record high C =
| Jun record high C =
| Jul record high C =
| Aug record high C =
| Sep record high C =
| Oct record high C =
| Nov record high C =
| Dec record high C =
<!-- Average high temperatures -->
| Jan high C =
| Feb high C =
| Mar high C =
| Apr high C =
| May high C =
| Jun high C =
| Jul high C =
| Aug high C =
| Sep high C =
| Oct high C =
| Nov high C =
| Dec high C =
| year high C =
<!-- Mean daily temperature -->
| Jan mean C =
| Feb mean C =
| Mar mean C =
| Apr mean C =
| May mean C =
| Jun mean C =
| Jul mean C =
| Aug mean C =
| Sep mean C =
| Oct mean C =
| Nov mean C =
| Dec mean C =
| year mean C =
<!-- Average low temperatures -->
| Jan low C =
| Feb low C =
| Mar low C =
| Apr low C =
| May low C =
| Jun low C =
| Jul low C =
| Aug low C =
| Sep low C =
| Oct low C =
| Nov low C =
| Dec low C =
| year low C =
<!-- Record low temperatures -->
| Jan record low C =
| Feb record low C =
| Mar record low C =
| Apr record low C =
| May record low C =
| Jun record low C =
| Jul record low C =
| Aug record low C =
| Sep record low C =
| Oct record low C =
| Nov record low C =
| Dec record low C =
<!-- Total precipitation, this should include rain and snow. -->
| Jan precipitation mm =
| Feb precipitation mm =
| Mar precipitation mm =
| Apr precipitation mm =
| May precipitation mm =
| Jun precipitation mm =
| Jul precipitation mm =
| Aug precipitation mm =
| Sep precipitation mm =
| Oct precipitation mm =
| Nov precipitation mm =
| Dec precipitation mm =
| year precipitation mm =
<!-- Rainfall -->
| Jan rain mm =
| Feb rain mm =
| Mar rain mm =
| Apr rain mm =
| May rain mm =
| Jun rain mm =
| Jul rain mm =
| Aug rain mm =
| Sep rain mm =
| Oct rain mm =
| Nov rain mm =
| Dec rain mm =
| year rain mm =
<!-- Snowfall -->
| Jan snow cm =
| Feb snow cm =
| Mar snow cm =
| Apr snow cm =
| May snow cm =
| Jun snow cm =
| Jul snow cm =
| Aug snow cm =
| Sep snow cm =
| Oct snow cm =
| Nov snow cm =
| Dec snow cm =
| year snow cm =
<!-- Average number of precipitation days -->
| unit precipitation days =
| Jan precipitation days =
| Feb precipitation days =
| Mar precipitation days =
| Apr precipitation days =
| May precipitation days =
| Jun precipitation days =
| Jul precipitation days =
| Aug precipitation days =
| Sep precipitation days =
| Oct precipitation days =
| Nov precipitation days =
| Dec precipitation days =
| year precipitation days =
<!-- Average number of rainy days -->
| unit rain days =
| Jan rain days =
| Feb rain days =
| Mar rain days =
| Apr rain days =
| May rain days =
| Jun rain days =
| Jul rain days =
| Aug rain days =
| Sep rain days =
| Oct rain days =
| Nov rain days =
| Dec rain days =
| year rain days =
<!-- Average number of snowy days -->
| unit snow days =
| Jan snow days =
| Feb snow days =
| Mar snow days =
| Apr snow days =
| May snow days =
| Jun snow days =
| Jul snow days =
| Aug snow days =
| Sep snow days =
| Oct snow days =
| Nov snow days =
| Dec snow days =
| year snow days =
<!-- Mandatory fields, source -->
| source = <ref name="">{{cite web |url= |title= |publisher= |access-date=March 15, 2016 }}</ref>
<!-- For a second source -->
| source 2 = <ref name="">{{cite web |url= |title= |publisher= |access-date=March 15, 2016 }}</ref>
}}<!-- Infobox ends -->
and then paste into a spreadsheet as column A. Then copy and paste each line of data into a text editor and do a search and replace (in my case it turns out to be replacing a tab with a line break. So that the average temperature looks like this: -4.7 -3.8 -0.5 4.4 8.9 12.7 16.0 15.4 10.8 5.7 -1.2 -4.6 4.9 Then paste that into column B. After that do a search and replace for tab and replace with a space. Then replace all double spaces with single spaces. Remove any unnecessary line (usually the remarks) and add the source(s). So: {{Weather box
| metric first = yes
| location = Beaver Mines (1981-2010)
| single line = yes
| Jan record high C = 13.3
| Feb record high C = 16.5
| Mar record high C = 22.0
| Apr record high C = 30.6
| May record high C = 30.0
| Jun record high C = 32.2
| Jul record high C = 35.6
| Aug record high C = 33.9
| Sep record high C = 35.0
| Oct record high C = 28.3
| Nov record high C = 23.9
| Dec record high C = 21.1
| Jan high C = 0.2
| Feb high C = 1.2
| Mar high C = 4.8
| Apr high C = 10.1
| May high C = 15.1
| Jun high C = 18.9
| Jul high C = 23.3
| Aug high C = 23.0
| Sep high C = 17.5
| Oct high C = 11.1
| Nov high C = 3.1
| Dec high C = -0.3
| year high C = 10.7
| Jan mean C = -4.7
| Feb mean C = -3.8
| Mar mean C = -0.5
| Apr mean C = 4.4
| May mean C = 8.9
| Jun mean C = 12.7
| Jul mean C = 16.0
| Aug mean C = 15.4
| Sep mean C = 10.8
| Oct mean C = 5.7
| Nov mean C = -1.2
| Dec mean C = -4.6
| year mean C = 4.9
| Jan low C = -9.5
| Feb low C = -8.7
| Mar low C = -5.7
| Apr low C = -1.3
| May low C = 2.7
| Jun low C = 6.4
| Jul low C = 8.5
| Aug low C = 7.8
| Sep low C = 4.1
| Oct low C = 0.2
| Nov low C = -5.4
| Dec low C = -8.9
| year low C = -0.8
| Jan record low C = -45.6
| Feb record low C = -43.3
| Mar record low C = -39.4
| Apr record low C = -27.8
| May record low C = -20.6
| Jun record low C = -3.9
| Jul record low C = -3.5
| Aug record low C = -7.0
| Sep record low C = -11.7
| Oct record low C = -29.4
| Nov record low C = -38.3
| Dec record low C = -44.4
| Jan precipitation mm = 35.0
| Feb precipitation mm = 38.9
| Mar precipitation mm = 52.5
| Apr precipitation mm = 60.3
| May precipitation mm = 92.4
| Jun precipitation mm = 108.9
| Jul precipitation mm = 50.9
| Aug precipitation mm = 48.7
| Sep precipitation mm = 61.1
| Oct precipitation mm = 46.8
| Nov precipitation mm = 50.4
| Dec precipitation mm = 33.9
| year precipitation mm = 679.8
| Jan rain mm = 4.4
| Feb rain mm = 3.2
| Mar rain mm = 4.5
| Apr rain mm = 17.2
| May rain mm = 74.2
| Jun rain mm = 107.4
| Jul rain mm = 50.9
| Aug rain mm = 47.2
| Sep rain mm = 54.7
| Oct rain mm = 19.6
| Nov rain mm = 11.9
| Dec rain mm = 4.0
| year rain mm = 399.2
| Jan snow cm = 30.6
| Feb snow cm = 35.7
| Mar snow cm = 48.0
| Apr snow cm = 43.1
| May snow cm = 18.2
| Jun snow cm = 1.6
| Jul snow cm = 0.0
| Aug snow cm = 1.5
| Sep snow cm = 6.4
| Oct snow cm = 27.2
| Nov snow cm = 38.5
| Dec snow cm = 29.9
| year snow cm = 280.6
| unit precipitation days = 0.2 mm
| Jan precipitation days = 7.0
| Feb precipitation days = 7.3
| Mar precipitation days = 9.9
| Apr precipitation days = 9.2
| May precipitation days = 11.4
| Jun precipitation days = 11.5
| Jul precipitation days = 7.6
| Aug precipitation days = 8.1
| Sep precipitation days = 8.7
| Oct precipitation days = 7.2
| Nov precipitation days = 8.3
| Dec precipitation days = 7.0
| year precipitation days = 103.2
| unit rain days = 0.2 mm
| Jan rain days = 1.6
| Feb rain days = 0.9
| Mar rain days = 2.4
| Apr rain days = 4.7
| May rain days = 10.3
| Jun rain days = 11.5
| Jul rain days = 7.6
| Aug rain days = 8.0
| Sep rain days = 8.3
| Oct rain days = 4.7
| Nov rain days = 2.9
| Dec rain days = 1.1
| year rain days = 63.9
| unit snow days = 0.2 cm
| Jan snow days = 5.7
| Feb snow days = 6.6
| Mar snow days = 8.0
| Apr snow days = 5.6
| May snow days = 2.2
| Jun snow days = 0.0
| Jul snow days = 0.0
| Aug snow days = 0.1
| Sep snow days = 1.2
| Oct snow days = 3.7
| Nov snow days = 6.1
| Dec snow days = 6.2
| year snow days = 45.4
| source = <ref name="ccn">{{cite web |url= http://climate.weather.gc.ca/climate_normals/results_1981_2010_e.html?stnID=2366&lang=e&province=AB&provSubmit=go&dCode=1 |title= Canadian Climate Normals 1981-2010 Station Data |publisher= [[Environment Canada]] |access-date=2016-03-18 }}</ref>
|}
and then into the article. |
- Some cautions. If the actual figure is 1.0 make sure the 0 is included. I usually do it in the spreadsheet. Don't mix rain/snow with total precipitation. In the above example, for June rain is 107.4, snow is 1.8 for a total of 109.2 but June precipitation is 108.9. This can be seen even more so at Cambridge Bay#Climate. This has to do with melting the snow to get a water equivalent. If you are doing a place that seems to have no recorded snow don't put the rain down as precipitation. It may or may not be the same. CambridgeBayWeather, Uqaqtuq (talk), Sunasuttuq 06:02, 19 March 2016 (UTC)
I know how to compute simple statistics, using a spreadsheet or whatever. But I notice your discussion does not use the Lua module=WeatherBox at all. Does that module have any utility, or does it automagically get run whenever one declares use of template='Weather box', or what? Tlroche (talk) 22:45, 19 March 2016 (UTC)
- I have no idea how to use Wikipedia:Lua and as the current template (and others) work fine there really is little incentive to use it. If you look at What links here for the Module:WeatherBox it appears that 12,000+ pages are transcluded. The major problem with the template is the total precipitation/rain/snow conversion from mm/cm to in. It should convert to 2 decimal places but it sometimes converts to 3. CambridgeBayWeather, Uqaqtuq (talk), Sunasuttuq 17:36, 20 March 2016 (UTC)
Mean monthly sunshine hours
The "Mean monthly sunshine hours" label is wrong for the "Year" column. The "Year" column gives the total of all the monthly means. Either the label should be changed to "Mean sunshine hours" or the "Year" column should give the mean monthly sunshine hours, similar to what it does for the "Mean daily sunshine hours" row. Kendall-K1 (talk) 16:10, 20 January 2016 (UTC)
I have fixed the label in the sandbox. Any objections before I roll this out? Kendall-K1 (talk) 01:18, 18 March 2016 (UTC)
- @Kendall-K1: In many climatological data, the total of all the monthly means for sunshine data is the correct form and the standard in all countries and by WMO. Unlike daily values, monthly sunshine is computed by summing up all of the daily hours of sunshine recorded in each day (see this example in Chile, pg 13 on the pdf file which computes both daily and monthly values) much like average precipitation. In contrast, the daily values are calculated by dividing the monthly sunshine values by the number of days in a month, similar to temperature (add up all the temperature values then divide it by the number of days in a month to obtain mean temperatures). The term monthly is needed to differentiate this from mean daily sunshine values. Ssbbplayer (talk) 15:09, 6 April 2016 (UTC)