
Warwick District Council elections
Warwick District Council elections are held every four years. Warwick District Council is the local authority for the non-metropolitan district of Warwick in Warwickshire, England. Since the last boundary changes in 2019, 44 councillors have been elected from 17 wards.[1]
Council elections[edit]
- 1973 Warwick District Council election
- 1976 Warwick District Council election
- 1979 Warwick District Council election
- 1983 Warwick District Council election (New ward boundaries)[2]
- 1987 Warwick District Council election
- 1991 Warwick District Council election
- 1995 Warwick District Council election (District boundary changes took place but the number of seats remained the same)[3][4]
- 1999 Warwick District Council election
- 2003 Warwick District Council election (New ward boundaries increased the number of seats by 1)[5][6]
- 2007 Warwick District Council election (Some new ward boundaries) [7]
- 2011 Warwick District Council election
- 2015 Warwick District Council election (New ward boundaries)[8]
- 2019 Warwick District Council election (New ward boundaries)[1]
- 2023 Warwick District Council election
Results maps[edit]
-
 2007 results map
 -
 2011 results map
 -
 2015 results map
 -
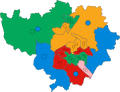
 2019 results map
 -
 2023 results map


By-election results[edit]
1995-1999[edit]
| Party | Candidate | Votes | % | ±% | |
|---|---|---|---|---|---|
| Labour | 2,401 | 49.1 | -9.4 | ||
| Conservative | 1,820 | 37.2 | +13.7 | ||
| Liberal Democrats | 666 | 13.6 | +1.8 | ||
| Majority | 581 | 11.9 | |||
| Turnout | 4,887 | ||||
| Labour hold | Swing | ||||
| Party | Candidate | Votes | % | ±% | |
|---|---|---|---|---|---|
| Conservative | 560 | 59.4 | +7.6 | ||
| Labour | 224 | 23.8 | -24.4 | ||
| Liberal Democrats | 159 | 16.9 | +16.9 | ||
| Majority | 336 | 35.6 | |||
| Turnout | 943 | 42.0 | |||
| Conservative hold | Swing | ||||
1999-2003[edit]
| Party | Candidate | Votes | % | ±% | |
|---|---|---|---|---|---|
| Labour | Misan McFarland | 2,236 | 52.4 | -3.7 | |
| Conservative | 1,320 | 30.9 | +4.7 | ||
| Liberal Democrats | 545 | 12.8 | +1.8 | ||
| Green | 167 | 3.9 | -2.8 | ||
| Majority | 916 | 21.5 | |||
| Turnout | 4,268 | ||||
| Labour hold | Swing | ||||
| Party | Candidate | Votes | % | ±% | |
|---|---|---|---|---|---|
| Labour | 1,837 | 48.7 | +0.5 | ||
| Conservative | 1,336 | 35.4 | +7.9 | ||
| Liberal Democrats | 430 | 11.4 | -1.2 | ||
| Green | 167 | 4.4 | -7.2 | ||
| Majority | 441 | 13.3 | |||
| Turnout | 3,770 | ||||
| Labour hold | Swing | ||||
| Party | Candidate | Votes | % | ±% | |
|---|---|---|---|---|---|
| Labour | 1,440 | 38.2 | +11.4 | ||
| Residents | 1,194 | 31.6 | -25.1 | ||
| Conservative | 761 | 20.2 | +9.5 | ||
| Liberal Democrats | 255 | 6.8 | +6.8 | ||
| Green | 123 | 3.3 | -2.5 | ||
| Majority | 246 | 6.6 | |||
| Turnout | 3,773 | ||||
| Labour gain from Independent | Swing | ||||
| Party | Candidate | Votes | % | ±% | |
|---|---|---|---|---|---|
| Conservative | 983 | 56.2 | +2.0 | ||
| Labour | 516 | 29.5 | +5.1 | ||
| Liberal Democrats | 249 | 14.2 | -2.0 | ||
| Majority | 467 | 26.7 | |||
| Turnout | 1,748 | 24.0 | |||
| Conservative hold | Swing | ||||
2003-2007[edit]
| Party | Candidate | Votes | % | ±% | |
|---|---|---|---|---|---|
| Conservative | Anne Mellor | 1,059 | 56.4 | +27.4 | |
| Liberal Democrats | David Manuel | 426 | 22.7 | +9.2 | |
| Labour | John Barrott | 300 | 16.0 | +1.7 | |
| Green | Juliet Nickels | 94 | 5.0 | -4.9 | |
| Majority | 633 | 33.7 | |||
| Turnout | 1,879 | 25.0 | |||
| Conservative hold | Swing | ||||
| Party | Candidate | Votes | % | ±% | |
|---|---|---|---|---|---|
| Conservative | Norman Vincett | 890 | 48.8 | +6.9 | |
| Liberal Democrats | Shirley Shilton | 674 | 37.0 | +19.1 | |
| Labour | Jeremy Eastaugh | 206 | 11.3 | -6.8 | |
| Independent | Brian Hadland | 52 | 2.9 | -10.2 | |
| Majority | 216 | 11.8 | |||
| Turnout | 1,822 | 31.3 | |||
| Conservative hold | Swing | ||||
2007-2011[edit]
| Party | Candidate | Votes | % | ±% | |
|---|---|---|---|---|---|
| Labour | Alan Wilkinson | 605 | 35.8 | -9.1 | |
| Conservative | Didar Kundi | 428 | 25.3 | +3.8 | |
| Liberal Democrats | Charlotte Farrington | 216 | 12.8 | -4.3 | |
| Green | Rebecca Knight | 209 | 12.4 | -4.1 | |
| BNP | Martin Smallwood | 136 | 8.0 | +8.0 | |
| Whitnash Residents | Clive Taylor | 96 | 5.7 | +5.7 | |
| Majority | 177 | 10.5 | |||
| Turnout | 1,690 | 29.0 | |||
| Labour hold | Swing | ||||
| Party | Candidate | Votes | % | ±% | |
|---|---|---|---|---|---|
| Conservative | Linda Bromley | 1,107 | 54.0 | +0.2 | |
| Labour | Chris McKeown | 648 | 31.6 | +13.3 | |
| Liberal Democrats | Chris Spedding | 294 | 14.3 | +0.2 | |
| Majority | 459 | 22.4 | |||
| Turnout | 2,049 | ||||
| Conservative hold | Swing | ||||
2015-2019[edit]
| Party | Candidate | Votes | % | ±% | |
|---|---|---|---|---|---|
| Conservative | Mary Noone | 488 | 53.6 | +2.5 | |
| Liberal Democrats | Nick Solman | 228 | 25.0 | +16.3 | |
| Labour | Ben Wesson | 194 | 21.3 | +21.3 | |
| Majority | 260 | 28.6 | +12.2 | ||
| Turnout | 910 | 22.3 | -53.3 | ||
| Conservative hold | Swing | ||||
| Party | Candidate | Votes | % | ±% | |
|---|---|---|---|---|---|
| Conservative | Trevor Wright | 502 | 52.6 | +13.0 | |
| Labour | Josh Payne | 311 | 32.6 | +15.1 | |
| Liberal Democrats | Richard Dickson | 113 | 11.8 | +11.8 | |
| Green | Chris Philpott | 29 | 3.0 | -10.3 | |
| Majority | 191 | 20.0 | |||
| Turnout | 955 | ||||
| Conservative hold | Swing | ||||
2019-2023[edit]
| Party | Candidate | Votes | % | ±% | |
|---|---|---|---|---|---|
| Liberal Democrats | Daniel Russell | 1,296 | 55.3 | +7.1 | |
| Conservative | Hayley Key | 664 | 28.3 | +11.1 | |
| Labour | Luc Lowndes | 384 | 16.4 | -5.5 | |
| Majority | 632 | 27.0 | |||
| Turnout | 2,344 | ||||
| Liberal Democrats hold | Swing | ||||
| Party | Candidate | Votes | % | ±% | |
|---|---|---|---|---|---|
| Conservative | Jacqui Grey | 1,710 | 39.3 | +4.2 | |
| Labour | Curtis Oliver-Smith | 1,079 | 24.8 | +1.0 | |
| Green | Paul Atkins | 812 | 18.7 | -1.1 | |
| Liberal Democrats | Hugh Foden | 644 | 14.8 | -6.4 | |
| Independent | Bob Dhillon | 103 | 2.4 | +2.4 | |
| Majority | 631 | 14.5 | |||
| Turnout | 4,348 | ||||
| Conservative hold | Swing | ||||
| Party | Candidate | Votes | % | ±% | |
|---|---|---|---|---|---|
| Labour | Colin Quinney | 1,370 | 42.5 | +8.0 | |
| Conservative | Frances Lasok | 761 | 23.6 | +6.0 | |
| Liberal Democrats | Hugh Foden | 539 | 16.7 | -12.8 | |
| Green | Ignaty Dyakov-Richmond | 431 | 13.4 | +1.2 | |
| Independent | Hafeez Ahmed | 103 | 3.2 | +3.2 | |
| SDP | Josh Payne | 16 | 0.5 | +0.5 | |
| Majority | 609 | 18.9 | |||
| Turnout | 3,220 | ||||
| Labour hold | Swing | ||||
| Party | Candidate | Votes | % | ±% | |
|---|---|---|---|---|---|
| Whitnash Residents | Adrian Barton | 835 | 55.2 | +5.7 | |
| Labour | Lucy Phillips | 431 | 28.5 | +6.5 | |
| Conservative | John Kane | 127 | 8.4 | +1.8 | |
| Green | Sarah Richards | 88 | 5.8 | -4.7 | |
| Liberal Democrats | Trevor Barr | 32 | 2.1 | -2.9 | |
| Majority | 404 | 26.7 | |||
| Turnout | 1,513 | ||||
| Whitnash Residents hold | Swing | ||||
| Party | Candidate | Votes | % | ±% | |
|---|---|---|---|---|---|
| Labour | Christopher King | 1,064 | 49.0 | +14.5 | |
| Liberal Democrats | Justine Ragany | 612 | 28.2 | -1.3 | |
| Conservative | Frances Lasok | 365 | 16.8 | -0.8 | |
| Green | Ignaty Dyakov-Richmond | 105 | 4.8 | -7.4 | |
| UKIP | Gerald Smith | 24 | 1.1 | -5.2 | |
| Majority | 452 | 20.8 | |||
| Turnout | 2,170 | ||||
| Labour hold | Swing | ||||
2023-2027[edit]
| Party | Candidate | Votes | % | ±% | |
|---|---|---|---|---|---|
| Labour | Claire Wightman | 961 | 52.5 | ||
| Conservative | Jody Tracey | 687 | 37.5 | ||
| Liberal Democrats | Laurence Byrne | 183 | 10.0 | ||
| Majority | 274 | 15.0 | |||
| Turnout | 1,831 | ||||
| Conservative hold | Swing | ||||
References[edit]
- ^ a b "The Warwick (Electoral Changes) Order 2018", legislation.gov.uk, The National Archives, SI 2018/1313, retrieved 8 September 2022
- ^ The District of Warwick (Electoral Arrangements) Order 1979
- ^ "The Hereford and Worcester, Warwickshire and West Midlands (County and Metropolitan Borough Boundaries) Order 1993", legislation.gov.uk, The National Archives, SI 1993/437, retrieved 8 September 2022
- ^ "The Warwickshire and West Midlands (County and District Boundaries) Order 1993", legislation.gov.uk, The National Archives, SI 1993/474, retrieved 5 November 2015
- ^ "Local elections". BBC News Online. Retrieved 13 September 2009.
- ^ "The District of Warwick (Electoral Changes) Order 2000", legislation.gov.uk, The National Archives, SI 2000/1677, retrieved 4 October 2015
- ^ "The Warwick (Parish Electoral Arrangements and Electoral Changes) Order 2007", legislation.gov.uk, The National Archives, SI 2007/685, retrieved 3 November 2015
- ^ "The Warwick (Electoral Changes) Order 2014", legislation.gov.uk, The National Archives, SI 2014/26, retrieved 8 September 2022
- ^ "Tories win by-election". Coventry Evening Telegraph. 5 November 2004. p. 2.
- ^ "Labour makes surprise byelection gain". guardian.co.uk. 3 March 2006. Retrieved 13 September 2009.
- ^ "Elections 2009". Warwick District Council. Retrieved 13 September 2009.
- ^ "Local Elections Archive Project — Warwick South Ward". www.andrewteale.me.uk. Retrieved 9 March 2024.
- ^ "Elections 2016". Warwick District Council. Retrieved 3 January 2017.
- ^ "Local Elections Archive Project — Stoneleigh and Cubbington Ward". www.andrewteale.me.uk. Retrieved 8 March 2024.
- ^ "Local Elections Archive Project — Leamington Lillington Ward". www.andrewteale.me.uk. Retrieved 8 March 2024.
- ^ "Local Elections Archive Project — Warwick Myton and Heathcote Ward". www.andrewteale.me.uk. Retrieved 8 March 2024.
- ^ "Local Elections Archive Project — Leamington Clarendon Ward". www.andrewteale.me.uk. Retrieved 8 March 2024.
- ^ "Local Elections Archive Project — Whitnash Ward". www.andrewteale.me.uk. Retrieved 8 March 2024.
- ^ "Local Elections Archive Project — Leamington Clarendon Ward". www.andrewteale.me.uk. Retrieved 8 March 2024.
- ^ "Local Elections Archive Project — Warwick All Saints and Woodloes Ward". www.andrewteale.me.uk. Retrieved 8 March 2024.