
User:Jonhanke496/AtlasModels
History of Stochastic Portfolio Theory[edit]
Once upon a time, in a far away land, there lived a stochastic portfolio ... =)
Note to Authors: Compare this with the introduction of the article Modern Portfolio Theory
Capital distributon curve[edit]
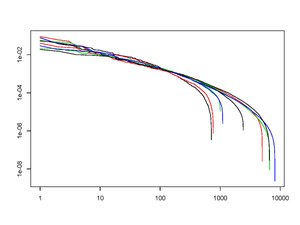
The capital distribution curve of a market of stocks is defined to be the plot of the ranked log market weights of the stocks in decreasing order (i.e. by their rank ) as a function of where the ranked market weights are a permutation of the unranked market weights defined for all by


where is the price of the -th stock at time . This curve shows a remarkable stability over time (see Figure A), and various market models (e.g. Atlas models, first-order models, second-order models) have been constructed to understand its stability and shape. In many markets this appears to follow a Pareto distribution.


Asymptotic stability[edit]
To understand the existence and stability of the capital distribution curve in a general stochastic market it is necessary to make some reasonable assumptions about its behavior. A useful class of markets to consider are those which are asymptotically stable, which is defined in [1] by the technical conditions of being coherent and that the difference of the log market weights of adjacent stocks (when ranked by their capitalization in decreasing order) have local time and variance with asymptotically constant slope. In more mathematical language, asymptotic stability of a stochastic market with stocks requires that
- for all (Coherence)

and that the parameters and defined by


exist for all . (Here and respectively denote the local time and quadratic variation process of a given continuous semimartingale process and denotes the -th ranked market weight process (i.e. in non-increasing order as increases).)


Functionally generated portfolios[edit]
A functionally generated portfolio (generated by a function ) is a portfolio that is both given as a function of the market weights and whose relative log-return with respect to the market portfolio satisfies the stochastic differential decomposition


where has no stochastic differential component. The importance of this relative return decomposition comes from the observation that often the function is known to be bounded, so the long-term behaviour of the relative performance comes from the behaviour of the drift process , and this drift can be usually given explicitly in terms of the generating function


Given a function satisfying mild continuity conditions (e.g. twice continuously differentiable), one can always write down a canonical functionally generated portfolio generated by given explicitly as


where

and where the product of two vectors is defined componentwise by . The drift process of this portfolio is given by the formula


Atlas models[edit]
An atlas model is a stochastic model for a market of stocks where the stock with the smallest total capitalization is given a large positive growth rate of while all other stocks are assumed to have zero growth rate. The name "atlas model" stems from the fact that the growth of the market is supported entirely by the growth of the smallest stock, by analogy with the mythological Atlas. Atlas models are useful as a way of understanding the stability of the capital distribution curve. Their mathematical simplicity allows one to prove that they are asymptotically stable and that in such a market the capital distribution curve is stable and given by an explicit Pareto distribution. The fact that even these simple models have a capital distribution curve that fairly accurately approximates its observed shape shows that the stability of the capital distribution curve is a fairly universal market phenomenon.

More mathematically, the atlas model with (positive) real parameters is defined by the stochastic differential equations


for all where the individual stock growth rates are given by


and the are independent Brownian motions. Here the parameters are respectively called the growth rate and variance of the atlas model.


Misc fragments[edit]
Fun with bold characters:


Even these simple models have a capital distribution curve that fairly accurately approximates its observed shape,
as a first-order approximation to market
References[edit]
- ^ Fernholz, E. Robert (2002). Stochastic Portfolio Theory. Springer Science+Business Media, Inc. p. 100. ISBN 0-387-95405-8.
Bold text