This is an archive of past discussions. Do not edit the contents of this page. If you wish to start a new discussion or revive an old one, please do so on the current talk page.
The linked graph does not explicitly disclose a date for a "kink" in the AD curve nor does the author, Coughlin, state one in the article publishing the graph. It would be difficult to trend data points from the graph since Coughlin apparently used a smooth curve function in connecting the data points. Even if one tried, the "kink" is dependent upon the number of data points selected for a recent trend line, which would be impermissible OR. The displayed White curve has a clear kink between two trend lines in the mid 2000s and the Anderson 2013 cite, depending upon how you read it, suggests a "kink" occurred between 2008 and 2010. The date of the "kink" appears to be inadvertent disagreement among sources - inadvertent, because we are interpreting the published data in a way that they perhaps never intended it to be used. Personally I think "since c. 2007-2011" is awkward and would suggest "after 2005" as a way of expressing all sources in a readable manner. It is also acceptable to just leave out a date for the kink as undue since does it really matter when the kink occurred? Tom94022 (talk) 16:45, 26 September 2014 (UTC)
The date of the inflection is discernible and notable. An analyst with Morningstar has indeed explicitly disclosed “around 2010” as the date of the slowing in areal density.[3] This analyst finds “a slowing areal density curve … that slowed around 2010 and will advance areal density 25% annually till 2020.”[4]71.128.35.13 (talk) 18:58, 26 September 2014 (UTC)
IMO the date of inflection is not discernible from Coughlin. Yet another analyst stating "around 2010" doesn't help much. Its pretty clear that different sources looking at different sets of data can find different dates for the "kink" which we could treat as difference among sources requiring some consideration to all or since it is not clear to me why the specific date of the "kink" is notable, we can just ignore this. Readability is important, isn't it? 22:42, 26 September 2014 (UTC)
Notability and relevance are the foundation of readability. Various analysts using different data sources have noted the inflection around 2010. Hitachi Data Systems Vice President and Chief Technology Officer, Hu Yoshida, writes that a “paper in the IEEE Transactions on Magnetics Vol 48 May 2012 shows that the roadmap for areal density increases in magnetic hard disk drives (HDD) has slowed down” and the paper has a chart “which shows that the decline has been going on since 2010.”[1]71.128.35.13 (talk) 17:44, 27 September 2014 (UTC)
Several references support the inflection “around 2010.” Is there a citation supporting "around 2006"? 71.128.35.13 (talk) 20:33, 28 September 2014 (UTC)
Other references support other inflection dates. Furthermore so do some u cite. Yoshida [1] acknowledges he has "written several times about the declining rate of areal bit densities" and the graph he points to clearly has an inflection in the middle 2000s to 40% CAGR since prior to that time there is universal agreement that the prior growth rate was in the range of 60-100%. Coughlin's chart appears to have an inflection circa 2005 and perhaps circa 2008; he is on the record that the CAGR circa 2010 was about 30%, again a substantial decline from 60-100%. I can't access the Morningstar reference so I can't comment on its perspective. We have to avoid an inappropriate synthesis which seems to have occurred in yr last edit. Actually an inflection date might not yet be at all appropriate since What appears to have been going on since the mid-2000s is that the AD rate of change has been more or less continuously been decreasing to the now current low of about 8-12% (of course, this might change with the next disk drive announcement, up or down). Since the data show a continuing slowdown rather than an inflection its not clear why any one date is more notable than another and it is more readable to just say something like
"However, the growth rate trend has been decreasing since 2006 and, as of 2014, growth has been in the annual range of 8–12%"
Depending upon the language, either the Yoshida or Coughlin reference would be appropriate, not both. Tom94022 (talk) 21:25, 28 September 2014 (UTC)
The edit simply changes “2006” to “2010”: “However, the trend decreased dramatically around 2010 and,[1][2][3] as of 2014[update], growth...”
The references are clear, accessible and support “around 2010”: Kaur of Morningstar sees a slowing areal density curve “that slowed around 2010.” [2] Yoshida indicates that “the decline has been going on since 2010.”[1]
Once again, the edit simply updates the inflection date from 2006 to 2010: “However, the trend decreased dramatically around 2010 and,[1][2][3] as of 2014[update], growth...”
Is there a citation for “around 2006”? 71.128.35.13 (talk) 23:44, 28 September 2014 (UTC)
Simply changing the date of an inflection point misleads by implying there has been only one inflection point since the CAGR was 60-100% circa 2005. There are at least two maybe more, or maybe none. At this point there are so few data points since 2010 that it is not clear that there has been an inflection about 2010. I suggest the important point to the reader is that it dropped from a very high level to the current level and not how it got there, one or two or no inflection points. Tom94022 (talk) 00:21, 29 September 2014 (UTC)
Just throw it all up against the wall, and see what sticks. Do any of them have support from reliable sources? Without support, none of them belongs in Wikipedia.
Two, maybe more inflections? No source has been presented to support this idea.
Maybe none (no inflection point)? No source has been shown to support this. This looks wacky on its face, and is difficult to reconcile with the historical data.
So few data points since 2010? This is not correct (it's wrong), because the shipping HDD density chart has products spaced eight months to one year apart.[3]
Only one inflection point? Yes indeed, bingo. Reliable sources (Yoshida of HDS and Morningstar) are directly quoted in support of an inflection “around 2010.” The following text has valid citations: “However, the trend decreased dramatically around 2010 and,[1][2][3] as of 2014[update], growth...” 71.128.35.13 (talk) 02:46, 30 September 2014 (UTC)
As I said before two of your citations support at least two inflection points. As usual you ignore evidence that contradicts your viewpoint. To repeat:
Coughlin 2014[3] clearly shows at least two possible changes in slope, one about 1Q2005 and the one you prefer about 1Q2009. Furthermore Coughlin in 2010 looking at an earlier version of the same chart stated, "AD growth appears to be slowing to ~30% annually."[4]
Yoshida 2013[1] acknowledges he has "written several times about the declining rate of areal bit densities" and the graph he points to clearly has an inflection in the middle 2000s to 40% CAGR since prior to that time there is universal agreement that the prior growth rate was in the range of 60-100%.
FWIW Coughlin 2014 looks like what a transition from what was exponential growth to what is now low linear growth in which case the slope thru any set of points on a semilog plot would continuously decline. If Coughlin published his data it would be interesting to see whether the data since 2006 best fit a linear curve or an exponential curve. This is one reason why I prefer the simple description rather than finding trends where they may not exist.
Correct me if I am wrong but unlike you I see about a two year gap in Coughlin 2014 data points from the about 1Q2011 to 1Q2013 and then only one or two points there after. At a 10% CAGR it takes 5 to 7 years to clearly see exponential growth and with only 1-3 data points covering 3 years its hard to call it an exponential trend (the other two trends in the section span 50 and 15 years with many points).
There is nothing about the quotes u cite that exclude the existence of decreases prior to 2010.
It is not necessary to have an explicit "around 2006" quote since we have reliable sources in graphs of Coughlin, Yoshida and Whyte that the slope changed around 2006. Since u found two of these sources I think that would be sufficient.
Reliable sources show that there are at least two inflection points, so that both the original statement and your proposed "simple" edit are incomplete and therefore misleading. The simplest statement is that the growth rate has been declining since about 2006 to about 8-10% in 2014. I suppose it is also accurate and more complete to say that AD CAGR dropped to about 30% per year from about 2006 to 2010 and dropped again to about 8-10% from 2011 to 2014, citing Coughlin 2014 and Anderson but that seems like too much detail. You should note I have omitted the word "dramatically" since it is not clear which is more dramatic, 100-60% dropping to 30% or 30$ dropping to 8-10% nor has the word been used in any source. I can live with either the complete description or the simple one but I prefer the simple version. The current one inflection description is misleading. Tom94022 (talk) 19:06, 1 October 2014 (UTC)
"Around 2010" doesn't rely on an unsupported, mis-leading editor interpretation of what's "shown." Reliable sources are quoted directly in support of "around 2010." Kaur of Morningstar sees a slowing areal density curve “that slowed around 2010.” [2] Yoshida indicates that “the decline has been going on since 2010.”[1] The Wikipedia editor who proposes a gradualist, vague, fuzzy, passive, non-inflected story-line must support that using clear, direct quotes from reliable sources. The citations must interpret this event, not a Wikipedia editor. 71.128.35.13 (talk) 20:09, 1 October 2014 (UTC)
"Around 2006" is neither more or less reliable than your preferred and only "around 2010." Perhaps u forgot that your original "around 2010" edit was based solely on your interpretation of the Coughlin 2014 graph. You continue to repeat yourself ignoring three reliable sources for a decrease around 2006. In the absence of consensus I guess the article will remain as is. Tom94022 (talk) 23:55, 1 October 2014 (UTC)
Actually the policy is "read the source, understand it, and then express what it says in your own words.". Yr self invented demand for a "clear direct quote" is actually contrary to the policy to "avoid copying.". There are three reliable sources (two of them found by you) showing the decline began about 2006 so unless you can find a reliable source that clearly shows something else then I will consider this matter closed and revise the article accordingly. If you revert to your one inflection construction I will then report you to WP:ANI for both edit warring and tendentious editing. Tom94022 (talk) 15:09, 2 October 2014 (UTC)
Density was still growing at a healthy rate, 30-40% per year, during 2006Q1-2010Q1.[3]71.128.35.13 (talk) 00:44, 3 October 2014 (UTC)
Since we apparently agree on the AD rate trend from 2006Q1-2010Q1 you must agree it was a decrease from the 60-100% per year trend for the fifteen years prior to 2006 I can see no reason for u to object to either of my proposed constructions. Your "simple" change in language ignores the substantial change in trend "around 2006" in favor of an equally substantial change in trend "around 2010." I have proposed two reasonable alternatives that encompass both trend changes, u seem fixated on just the 2010 change. Why don't u propose some language that encompasses the changes over the entire period from 2006 to the 8-12% currently cited and agreed upon? Tom94022 (talk) 22:58, 7 October 2014 (UTC)
Near-normal growth, 30–40% per year, or above-normal growth was sustained through 2010. The sag “around 2010,” not 2006, is notable and departs from the trend of the decades preceding:
“
However, the trend decreased dramatically around 2010 and,[1][2][3] as of 2014[update], growth has been in the annual range of 8–12%.[5][6]
”
71.128.35.13 (talk) 8 October 2014 (UTC)
I won't waste anymore time or space; yr proposed sentence is unacceptable in that it misleads a reader into thinking the only change occurred "around 2010" when all sources clearly show a substantive change "around 2006" from a then normal growth of 60-100% per year. Tom94022 (talk) 06:32, 9 October 2014 (UTC)
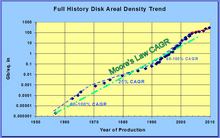
The rate of growth did not change substantially around 2006.[7][8]Leading-edge hard disk drive areal densities from 1956 through 2009 compared to Moore's law[5] Normal growth was 40% per year over five decades, and above normal was 60–100% per year.[9][6] Density was still growing at a healthy rate, 30-40% per year, during 2006Q1-2010Q1.[3]71.128.35.13 (talk) 19:33, 9 October 2014 (UTC)
I won't waste anymore time or space; yr proposed sentence is unacceptable. The growth rate from 1990-2005 was 60-100% per year according to most sources and most sources show a decrease about 2006. Tom94022 (talk) 21:26, 9 October 2014 (UTC)
The claim of a decrease around 2006 has no support (is unreferenced); actually, the references indicate that the rate of growth did not change substantially around 2006.[10][11][7]
I won't waste anymore time or space; all of your cited references support a decrease around 2006, u just choose to ignore their support. Tom94022 (talk) 23:23, 9 October 2014 (UTC)
This quote from a journal article contradicts the claim of a decrease below the historic normal rate around 2006: “Over the past five years [through 2011] innovations such as the use of perpendicular recording have allowed for continued growth in AD although at more moderate and historic rates of 40-50%.”[12]
As usual u again cite the same source, ignoring or deliberately distorting it. According to this source, 2006 (i.e, 2011-5) is fairly characterized as a point at which the growth was not as moderate as 40-50%, it was as we well know, 60-100%. I am really tired of your inability or unwillingness to accurately summarize the many sources all of whom see a growth rate of 60-100% from 1990 to about 2005 and declining thereafter. Tom94022 (talk) 22:51, 11 October 2014 (UTC)
Growth fell below the historical normal of 40% per year since 2010: "roadmap for areal density increases in magnetic hard disk drives (HDD) has slowed down … the decline has been going on since 2010"[1]71.128.35.13 (talk) 16:54, 13 October 2014
As usual u again cite a known source, ignoring or deliberately distorting it. This source displays no data prior to 2004 showing a 40% growth rate from 2004-2006. Since we know the growth rate was 60-100% from 1990 to 2005, this source also supports a decline from 60-100% to 40% around 2006 (that is the lines would cross in 2005). I am really tired of your inability or unwillingness to accurately summarize the many sources all of whom see a growth rate of 60-100% from 1990 to about 2005 and declining thereafter. Continuously citing the same sources over and over again without any new discussion or insight is really unhelpful. Tom94022 (talk) 00:25, 14 October 2014 (UTC)
Figure 1 shows growth was around 45% per year from 1990 to 2005, and it held steady (did not decline) around 2006.[8]71.128.35.13 (talk) 02:29, 14 October 2014 (UTC)
As usual u again cite a known source, ignoring or deliberately distorting it. It clearly shows a growth rate of 100% per year into the 2000s - to my eyes circa 2003 which is about 2006 for these purposes. You started this odyssey with Coughlin[3] which has every data point thru 1Q2005 to the left of a 60% per year CAGR line, how can you now seriously argue around 45% per year since 1990? Tom94022 (talk) 23:14, 19 October 2014 (UTC)
Fontana, Decad, and Hetzler of Almaden Res. Center, IBM Syst. Technol. Group (2012) find no slowing of growth around 2006. This contradicts the claim of a 2006 slowdown found in this WP article. Instead, they report a slight pickup in growth around 2005. They put product density growth at 40% per year from 1991 to 1998, at 100% through 2002, at 20% through 2005, at 40% through around 2010 and forecast a slowing to maybe 20% through around 2014.[9] Slide 11: “Areal Density vs. Moore's Law” 71.128.35.13 (talk) 02:29, 21 October 2014 (UTC)
Fontana et al show a slow down beginning about 2002 which is neither 2006 nor 2010 and is perfectly consistent with my objection to both the current statement and your proposed "simple" edit thereto. I have made two proposals for language that captures the slow down and all you do is insist upon your "simple" edit, only identifying 2010 as the slowdown; it is just as inaccurate as the current language. All the sources you have cited show slowing down before 2010. Until you accept one of my proposals or come up with a reasonably accurate edit on your own I am afraid this part of the article will remain as is. Tom94022 (talk) 00:38, 23 October 2014 (UTC)
Be not afraid. Though the time-line in the article lacks veracity, it has verisimilitude. 71.128.35.13 (talk) 23:02, 24 October 2014 (UTC)
Both the current statement and yr proposed change have truthiness. All of the sources point to AD trend dropping below a 60-100% trend well prior to 2010, some as early as 2002. This is fairly summarized by replacing the current sentence as follows:
Current Sentence
However, the trend decreased dramatically around 2006 and, as of 2014, growth has been in the annual range of 8–12%.[44][45]
Proposed Replacement
However, beginning around the mid-2000s the growth trend began decreasing and, as of 2014, growth has been in the annual range of 8–12%.
[44][45]
I believe this accurately summarizes all the sources you have provided. Tom94022 (talk) 07:01, 31 October 2014 (UTC)
Growth was near the normal 40% per year, not substantially below normal, in 2005‒2010: “Over the past five years [through 2010] innovations such as the use of perpendicular recording have allowed for continued growth in AD although at more moderate and historic rates of 40‒50%.” See figure 1. [10] The following correction is accurate, fair and supported:
Current sentence
However, the trend decreased dramatically around 2006 and, as of 2014, growth has been in the annual range of 8–12%.[44][45]
Date correction
However, the trend decreased dramatically around 2010 and, as of 2014, growth has been in the annual range of 8–12%.[44][45]
I am really disappointed that u continue to propose the same change. Sorry, your selective use of ill defined quotes to contradict the evidence of all reliable sources does not convince me or any other editor that the current sentence is significantly less accurate than your proposed change. Why won't u propose something different - otherwise the current sentence remains? Tom94022 (talk) 18:48, 1 November 2014 (UTC)
The current sentence remains. 71.128.35.13 (talk) 01:50, 4 November 2014 (UTC)
Please arrive at consensus here, and THEN change the article accordingly
You two are edit-warring in the article. Edit-warring is not confined to simple reverts. Once a disagreement over content is evident, the subject text should be reverted to its pre-dispute state (I've done that) and no further changes should be made to the affected part of the article until a new consensus has been established via talk page discussion. Repeatedly changing the article back and forth, even if you think your change is backed by sources and that those sources are definitive, is unproductive, tendentious, disrespectful of other editors, and confuses readers. If you persist I'm going to report BOTH of you to AN/I and let them sort it out. Jeh (talk) 19:48, 27 September 2014 (UTC)
Your revert is unjustified. Here's why:
“Sometimes editors will undo a change, justifying their revert merely by saying that there is 'no consensus' for the change.”
“If the only thing you have to say about a contribution to the encyclopedia is that it lacks consensus, it's best not to revert it.”WP:DRNC
“Your bias should be toward keeping the entire edit.”WP:ROWN BTW, please do report. Outside opinion(s) are welcome. 71.128.35.13 (talk) 20:31, 28 September 2014 (UTC)
You are wikilawyering, grubbing around for WIKI: pages that seem to support your edit, while ignoring the fact that there is an ongoing dispute and you should not be continuing to edit the article once a dispute is evident. What you've quoted there comes from essays, the opinions of the individual writers. They don't even have the status of guidelines. Nor are they really applicable: We're not talking about a single edit here that lacked consensus. We're talking about the ongoing dispute being carried out in mainspace. Reversion was IMO necessary if only to give you each a dash of cold water in the face. Jeh (talk) 08:47, 29 September 2014 (UTC)
Anyway, your arguing on this point makes me tired. Just discuss it here, 'K? It won't kill you. Jeh (talk) 08:55, 29 September 2014 (UTC)
I agree with the revert and will try to come to a consensus, but this has been shown to be difficult in the past. FWIW, I only made one edit in the article's relevant section. Tom94022 (talk) 21:25, 28 September 2014 (UTC)
^ abcdefghijYoshida, Hu (2013-02-19). "HDDs and NAND Flash will be Around for Some Time". blogs.hds. Hitachi Data Systems. Retrieved 2014-09-27. roadmap for areal density increases in magnetic hard disk drives (HDD) has slowed down … the decline has been going on since 2010
^ abcdefghiCoughlin, Tom (2014-09-16). "shipping HDD maximum areal density over time". Coughlin Associates www.tomcoughlin.com. Atascadero, CA: Forbes. Retrieved 2014-09-23. technology transitions are coming more slowly now for HDD companies than in the past ... for shipping HDD maximum areal density over time
^[1] Invest in New Technologies or Divest in Market Share, Coughlin Associates, (c)2010
^Coughlin, Tom (2014-04-07). "New Areal Density Point for Cloud Storage HDDs". Coughlin Associates www.tomcoughlin.com. Atascadero, CA: Forbes. Retrieved 2014-06-09. (overall 12%/yr from 2011Q3 to April 2014) represents roughly a 25% areal density increase ... this is the first increase in drive areal density since a 7% increase in Q2 2013. The increase in Q2 2013 was the first one since Q3 2011
^Dave Anderson (2013). "HDD Opportunities & Challenges, Now to 2020"(PDF). Seagate. Retrieved 2014-05-23. PMR CAGR slowing from historical 40+% down to ~8-12%" and "HAMR CAGR = 20-40% for 2015-2020
^Plumer, Martin L.; et al. (March 2011). "New Paradigms in Magnetic Recording"(PDF). Physics in Canada. 67 (1): 28. Retrieved 8 October 2014. See figure 1. … Over the past five years innovations such as the use of perpendicular recording have allowed for continued growth in AD although at more moderate and historic rates of 40-50%.{{cite journal}}: Explicit use of et al. in: |last= (help)
^Plumer, Martin L.; et al. (March 2011). "New Paradigms in Magnetic Recording"(PDF). Physics in Canada. 67 (1): 28. Retrieved 8 October 2014. approximate 40% compound areal density growth rate that the HDD industry has delivered over the past 50 years … Over the past five years innovations such as the use of perpendicular recording have allowed for continued growth in AD although at more moderate and historic rates of 40-50%.{{cite journal}}: Explicit use of et al. in: |last= (help)
^Plumer, Martin L.; et al. (March 2011). "New Paradigms in Magnetic Recording"(PDF). Physics in Canada. 67 (1): 28. Retrieved 8 October 2014. See figure 1. … Over the past five years innovations such as the use of perpendicular recording have allowed for continued growth in AD although at more moderate and historic rates of 40-50%.{{cite journal}}: Explicit use of et al. in: |last= (help)
^Plumer, Martin L.; et al. (March 2011). "New Paradigms in Magnetic Recording"(PDF). Physics in Canada. 67 (1): 28. Retrieved 8 October 2014. See figure 1. … Over the past five years innovations such as the use of perpendicular recording have allowed for continued growth in AD although at more moderate and historic rates of 40-50%.{{cite journal}}: Explicit use of et al. in: |last= (help)


![[2]](https://blogs-images.forbes.com/tomcoughlin/files/2014/09/HDD-AD-Chart.png)