Results of the 42nd Canadian federal election
2015 Canadian federal election
This lists parties that won seats. See the complete results below.
The 42nd Canadian federal election was held on October 19, 2015. The incumbent Conservative Party of Canada of Prime Minister Stephen Harper , in office since 2006 , was defeated by the Liberal Party of Canada under the leadership of Justin Trudeau . The Liberals rebounded from third place in the House of Commons with 36 seats to a strong majority government with 184 of the 338 seats in the expanded Commons. The Liberals picked up 148 seats, easily the biggest numerical increase for a Canadian party since Confederation.
Summary [ edit ] A polling station on election day At 9:41pm EDT, October 19, 2015, CBC News projected that the Liberals had won at least a minority government, and that leader Justin Trudeau would become the next Prime Minister of Canada. Less than an hour later, at 10:36pm EDT, CBC News projected a Liberal majority. The New Democratic Party lost more than half the seats they had held, with Tom Mulcair becoming the first major party leader to concede defeat. The Conservatives dropped down to 99 seats to form the main opposition party, and Stephen Harper resigned as leader of the Conservative Party. The Bloc Québécois regained some ridings they had lost in the previous election, but party leader Giles Duceppe failed to regain the seat he lost back in 2011. Green Party leader Elizabeth May kept her seat.[1]
According to preliminary figures from Elections Canada, more than 68 per cent of eligible voters cast a ballot, or about 17,546,697 registered electors—a seven percentage point increase from the 2011 federal election, when turnout was just more than 61 per cent.[2]
Synopsis of results [ edit ]
Results by riding - 2015 Canadian federal election[a 1] [a 2] [a 3]
Riding
Prov/
2011 Redist. )
Winning party
Turnout[a 4]
Votes[a 5]
Type[a 6]
Party
Party
Votes
Share
Margin
Margin
Lib
Con
NDP
BQ
Green
Ind
Other
Total[a 7]
Banff—Airdrie AB
MOD
Con
Con
42,228
63.4%
24,848
37.3%
71.8%
17,380
42,228
4,521
–
2,509
–
–
66,638
Battle River—Crowfoot AB
MOD
Con
Con
47,552
80.9%
42,047
71.5%
72.1%
5,505
47,552
3,844
–
1,868
–
–
58,769
Bow River AB
NEW
Con
Con
38,701
77.4%
31,861
63.7%
65.9%
6,840
38,701
2,622
–
919
543
363
49,988
Calgary Centre AB
MOD
Con
Lib
28,496
46.5%
750
1.2%
70.1%
28,496
27,746
3,412
–
1,347
248
–
61,249
Calgary Confederation AB
MOD
Con
Con
30,669
45.9%
1,586
2.4%
73.6%
29,083
30,669
4,770
–
2,146
–
140
66,808
Calgary Forest Lawn AB
MOD
Con
Con
19,694
48.0%
4,932
12.0%
54.9%
14,762
19,694
4,006
–
1,229
–
1,356
41,047
Calgary Heritage AB
MOD
Con
Con
37,263
63.8%
22,091
37.8%
72.6%
15,172
37,263
4,255
–
1,246
248
246
58,430
Calgary Midnapore AB
MOD
Con
Con
42,415
66.7%
28,019
44.1%
72.6%
14,396
42,415
4,915
–
1,691
–
145
63,562
Calgary Nose Hill AB
MOD
Con
Con
32,760
60.0%
18,089
33.2%
66.7%
14,671
32,760
4,836
–
1,384
–
911
54,562
Calgary Rocky Ridge AB
NEW
Con
Con
38,229
60.4%
18,191
28.7%
72.1%
20,038
38,229
3,665
–
1,360
–
–
63,292
Calgary Shepard AB
NEW
Con
Con
43,706
65.9%
27,327
41.2%
67.9%
16,379
43,706
4,532
–
1,734
–
–
66,351
Calgary Signal Hill AB
MOD
Con
Con
37,858
60.6%
18,750
30.0%
73.3%
19,108
37,858
3,128
–
1,586
–
839
62,519
Calgary Skyview AB
MOD
Con
Lib
20,644
45.9%
2,759
6.1%
60.7%
20,644
17,885
3,605
–
846
182
1,831
44,993
Edmonton Centre AB
MOD
Con
Lib
19,902
37.2%
1,199
2.2%
67.0%
19,902
18,703
13,084
–
1,403
163
257
53,512
Edmonton Griesbach AB
MOD
Con
Con
19,157
40.0%
2,848
5.9%
59.1%
10,397
19,157
16,309
–
1,129
–
950
47,942
Edmonton Manning AB
NEW
Con
Con
22,166
45.2%
8,657
17.7%
60.5%
13,509
22,166
11,582
–
1,079
540
125
49,001
Edmonton Mill Woods AB
MOD
Con
Lib
20,423
41.2%
92
0.2%
66.6%
20,423
20,331
6,330
–
1,096
560
777
49,517
Edmonton Riverbend AB
MOD
Con
Con
28,805
49.9%
11,377
19.7%
70.4%
17,428
28,805
9,846
–
1,275
–
386
57,740
Edmonton Strathcona AB
MOD
NDP
NDP
24,446
44.0%
7,051
12.7%
71.0%
11,524
17,395
24,446
–
1,278
223
738
55,604
Edmonton West AB
MOD
Con
Con
26,370
49.3%
7,721
14.4%
66.2%
18,649
26,370
6,955
–
1,037
–
446
53,457
Edmonton—Wetaskiwin AB
NEW
Con
Con
44,949
65.8%
30,289
44.3%
67.9%
14,660
44,949
6,645
–
1,595
–
495
68,344
Foothills AB
MOD
Con
Con
46,166
75.7%
38,017
62.3%
73.1%
8,149
46,166
3,919
–
1,983
–
769
60,986
Fort McMurray—Cold Lake AB
MOD
Con
Con
28,625
60.6%
15,222
32.2%
60.8%
13,403
28,625
3,663
–
743
–
832
47,266
Grande Prairie-Mackenzie AB
MOD
Con
Con
38,895
72.9%
31,076
58.3%
64.7%
7,819
38,895
4,343
–
1,673
–
613
53,343
Lakeland AB
MRG
Con
Con
39,882
72.8%
32,382
59.1%
68.9%
7,500
39,882
7,500
–
1,283
–
601
54,779
Lethbridge AB
MOD
Con
Con
32,321
56.8%
20,647
36.3%
67.7%
10,532
32,321
11,674
–
1,461
–
955
56,943
Medicine Hat—Cardston—Warner AB
MOD
Con
Con
34,849
68.8%
25,764
50.9%
65.2%
9,085
34,849
4,897
–
1,319
500
–
50,650
Peace River—Westlock AB
NEW
Con
Con
34,342
69.4%
27,215
55.0%
64.1%
6,360
34,342
7,127
–
1,247
–
443
49,519
Red Deer—Lacombe AB
MOD
Con
Con
43,599
70.7%
34,364
55.7%
69.4%
9,235
43,599
7,055
–
1,773
–
–
61,662
Red Deer—Mountain View AB
MOD
Con
Con
46,245
74.3%
37,889
60.9%
70.6%
8,356
46,245
5,233
–
1,621
–
757
62,212
St. Albert—Edmonton AB
MOD
Con
Con
26,783
45.2%
13,440
22.7%
69.7%
13,343
26,783
6,609
–
821
11,652
–
59,208
Sherwood Park—Fort Saskatchewan AB
MOD
Con
Con
42,642
63.9%
29,027
43.5%
74.1%
13,615
42,642
6,540
–
1,648
1,563
678
66,686
Sturgeon River—Parkland AB
NEW
Con
Con
43,220
70.2%
33,634
54.7%
70.9%
9,586
43,220
6,166
–
1,875
–
690
61,537
Yellowhead AB
MOD
Con
Con
37,950
72.3%
30,483
58.0%
69.3%
7,467
37,950
4,753
–
1,538
–
817
52,525
Abbotsford BC
MOD
Con
Con
23,229
48.3%
7,452
15.5%
69.7%
15,777
23,229
6,593
–
2,416
–
109
48,124
Burnaby North—Seymour BC
CHG
Con
Lib
18,938
36.1%
3,401
6.5%
70.3%
18,938
14,612
15,537
–
2,765
207
423
52,480
Burnaby South BC
NEW
NDP
NDP
16,094
35.1%
547
1.2%
60.8%
15,547
12,441
16,094
–
1,306
–
499
45,887
Cariboo—Prince George BC
MOD
Con
Con
19,688
36.6%
2,767
5.1%
67.8%
16,921
19,688
13,879
–
1,860
1,059
327
53,734
Central Okanagan—Similkameen—Nicola BC
MOD
Con
Con
24,517
39.6%
1,458
2.4%
71.0%
23,059
24,517
11,961
–
2,436
–
–
61,973
Chilliwack—Hope BC
MOD
Con
Con
21,445
42.3%
4,331
8.5%
69.7%
17,114
21,445
9,218
–
2,386
–
498
50,661
Cloverdale—Langley City BC
NEW
Con
Lib
24,617
45.5%
5,817
10.8%
69.4%
24,617
18,800
8,463
–
2,195
–
–
54,075
Coquitlam—Port Coquitlam BC
MOD
Con
Lib
19,938
35.3%
1,855
3.3%
66.7%
19,938
18,083
15,400
–
2,076
–
1,014
56,511
Courtenay—Alberni BC
MOD
Con
NDP
26,582
38.1%
6,868
9.8%
75.9%
15,212
19,714
26,582
–
8,201
–
140
69,849
Cowichan—Malahat—Langford BC
MOD
NDP
NDP
22,200
35.9%
7,515
12.2%
75.7%
14,685
14,091
22,200
–
10,462
–
340
61,778
Delta BC
NEW
Con
Lib
27,355
49.1%
9,100
16.3%
74.5%
27,355
18,255
8,311
–
1,768
–
–
55,689
Esquimalt—Saanich—Sooke BC
MOD
NDP
NDP
23,836
35.0%
5,214
7.7%
75.0%
18,622
11,912
23,836
–
13,575
–
136
68,081
Fleetwood—Port Kells BC
MOD
Con
Lib
22,871
46.9%
8,596
17.6%
65.2%
22,871
14,275
10,463
–
1,154
–
–
48,763
Kamloops—Thompson—Cariboo BC
MOD
Con
Con
24,595
35.3%
3,129
4.5%
73.4%
21,215
24,595
21,466
–
2,489
–
–
69,765
Kelowna—Lake Country BC
MOD
Con
Lib
29,614
46.2%
4,112
6.4%
70.7%
29,614
25,502
9,039
–
–
–
–
64,155
Kootenay—Columbia BC
MOD
Con
NDP
23,529
37.2%
282
0.4%
73.0%
12,315
23,247
23,529
–
4,115
–
–
63,206
Langley—Aldergrove BC
MOD
Con
Con
27,333
45.6%
5,439
9.1%
72.4%
21,894
27,333
7,490
–
2,644
–
535
59,896
Mission—Matsqui—Fraser Canyon BC
NEW
Con
Lib
16,625
37.2%
1,038
2.3%
70.4%
16,625
15,587
9,174
–
2,293
914
58
44,651
Nanaimo—Ladysmith BC
NEW
NDP
NDP
23,651
33.2%
6,898
9.7%
75.0%
16,753
16,637
23,651
–
14,074
–
126
71,241
New Westminster—Burnaby BC
MOD
NDP
NDP
22,876
43.5%
7,623
14.5%
65.9%
15,253
10,512
22,876
–
2,487
–
1,514
52,642
North Island—Powell River BC
MOD
Con
NDP
24,340
40.2%
8,500
14.0%
74.6%
15,416
15,840
24,340
–
4,940
–
–
60,536
North Okanagan—Shuswap BC
MOD
Con
Con
27,490
39.3%
6,541
9.4%
71.9%
20,949
27,490
17,907
–
3,608
–
–
69,954
North Vancouver BC
MOD
Con
Lib
36,458
56.7%
19,157
29.8%
75.8%
36,458
17,301
5,015
–
5,350
94
136
64,354
Pitt Meadows—Maple Ridge BC
MOD
Con
Lib
17,673
33.9%
1,300
2.5%
72.0%
17,673
16,373
15,450
–
2,202
452
–
52,150
Port Moody—Coquitlam BC
CHG
Con
NDP
19,706
36.0%
2,818
5.2%
68.9%
16,888
16,112
19,706
–
1,878
–
83
54,667
Prince George—Peace River—Northern Rockies BC
MOD
Con
Con
27,237
52.5%
14,324
27.6%
66.5%
12,913
27,237
8,014
–
2,672
–
1,023
51,859
Richmond Centre BC
MOD
Con
Con
17,622
44.2%
1,136
2.8%
57.5%
16,486
17,622
4,602
–
1,152
–
–
39,862
Saanich—Gulf Islands BC
MOD
Grn
Grn
37,070
54.4%
23,810
34.9%
78.7%
11,380
13,260
6,181
–
37,070
–
249
68,140
Skeena—Bulkley Valley BC
MOD
NDP
NDP
22,531
51.1%
11,595
26.3%
68.3%
8,257
10,936
22,531
–
1,605
–
780
44,109
South Okanagan—West Kootenay BC
CHG
Con
NDP
24,823
37.3%
4,952
7.4%
72.6%
18,732
19,871
24,823
–
2,792
376
–
66,594
South Surrey—White Rock BC
MOD
Con
Con
24,934
44.0%
1,439
2.5%
74.0%
23,495
24,934
5,895
–
1,938
–
369
56,631
Steveston—Richmond East BC
MOD
Con
Lib
19,486
45.1%
2,856
6.6%
60.2%
19,486
16,630
5,248
–
1,587
–
274
43,225
Surrey Centre BC
MOD
NDP
Lib
19,471
45.1%
6,479
15.0%
60.5%
19,471
8,556
12,992
–
1,493
–
686
43,198
Surrey—Newton BC
MOD
NDP
Lib
24,869
56.0%
13,267
29.9%
67.9%
24,869
6,978
11,602
–
975
–
–
44,424
Vancouver Centre BC
MOD
Lib
Lib
32,554
56.1%
20,936
36.1%
65.9%
32,554
9,818
11,618
–
3,370
–
688
58,048
Vancouver East BC
ORG
NDP
NDP
29,316
49.9%
12,784
21.8%
66.2%
16,532
6,322
29,316
–
5,395
216
927
58,708
Vancouver Granville BC
NEW
Con
Lib
23,643
43.9%
9,181
17.1%
67.1%
23,643
14,028
14,462
–
1,691
–
–
53,824
Vancouver Kingsway BC
MOD
NDP
NDP
20,763
45.7%
8,138
17.9%
63.3%
12,625
9,538
20,763
–
1,476
–
994
45,396
Vancouver Quadra BC
MOD
Lib
Lib
31,102
58.7%
17,419
32.9%
69.9%
31,102
13,683
5,748
–
2,229
59
151
52,972
Vancouver South BC
MOD
Con
Lib
21,773
48.8%
6,658
14.9%
63.2%
21,773
15,115
6,230
–
1,149
–
344
44,611
Victoria BC
ORG
NDP
NDP
30,397
42.3%
6,731
9.4%
76.2%
8,489
8,480
30,397
–
23,666
124
739
71,895
West Vancouver—Sunshine Coast—Sea to Sky Country BC
MOD
Con
Lib
36,300
54.6%
18,889
28.4%
73.6%
36,300
17,411
6,554
–
5,907
–
286
66,458
Brandon—Souris MB
MOD
Con
Con
20,666
50.3%
5,328
13.0%
67.3%
15,338
20,666
2,576
–
2,526
–
–
41,106
Charleswood—St. James—Assiniboia—Headingley MB
ORG
Con
Lib
24,531
52.0%
6,123
13.0%
73.9%
24,531
18,408
2,842
–
1,376
–
–
47,157
Churchill—Keewatinook Aski MB
MOD
NDP
NDP
13,487
45.0%
912
3.0%
58.1%
12,575
3,090
13,487
–
537
–
255
29,944
Dauphin—Swan River—Neepawa MB
MOD
Con
Con
19,276
46.3%
7,000
16.8%
65.3%
12,276
19,276
5,097
–
1,592
3,357
–
41,598
Elmwood—Transcona MB
MOD
Con
NDP
14,709
34.1%
61
0.1%
65.6%
12,713
14,648
14,709
–
1,016
–
–
43,086
Kildonan—St. Paul MB
MOD
Con
Lib
18,717
42.7%
1,239
2.8%
70.7%
18,717
17,478
6,270
–
783
142
485
43,875
Portage—Lisgar MB
MOD
Con
Con
25,060
60.8%
14,439
35.1%
65.4%
10,621
25,060
2,554
–
1,637
–
1,315
41,187
Provencher MB
MOD
Con
Con
25,086
56.1%
9,577
21.4%
67.9%
15,509
25,086
2,371
–
1,779
–
–
44,745
Saint Boniface—Saint Vital MB
MOD
Con
Lib
28,530
58.4%
14,525
29.8%
74.0%
28,530
14,005
5,169
–
1,119
–
–
48,823
Selkirk—Interlake—Eastman MB
MOD
Con
Con
25,617
51.9%
10,109
20.5%
68.6%
15,508
25,617
5,649
–
1,707
–
882
49,363
Winnipeg Centre MB
ORG
NDP
Lib
18,471
54.5%
8,981
26.5%
60.0%
18,471
4,189
9,490
–
1,379
–
356
33,885
Winnipeg North MB
CHG
NDP
Lib
23,402
68.9%
18,209
53.6%
58.4%
23,402
5,193
4,543
–
826
–
–
33,964
Winnipeg South MB
MOD
Con
Lib
28,096
58.3%
11,387
23.6%
74.9%
28,096
16,709
2,404
–
990
–
–
48,199
Winnipeg South Centre MB
MOD
Con
Lib
31,993
59.7%
16,891
31.5%
76.3%
31,993
15,102
4,799
–
1,677
–
–
53,571
Acadie—Bathurst NB
MOD
NDP
Lib
25,845
50.7%
5,766
11.3%
76.8%
25,845
3,852
20,079
–
1,187
–
–
50,963
Beauséjour NB
MOD
Lib
Lib
36,534
69.0%
28,525
53.9%
79.6%
36,534
6,017
8,009
–
2,376
–
–
52,936
Fredericton NB
MOD
Con
Lib
23,016
49.3%
9,736
20.8%
75.7%
23,016
13,280
4,622
–
5,804
–
–
46,722
Fundy Royal NB
MOD
Con
Lib
19,136
40.9%
1,775
3.8%
74.6%
19,136
17,361
8,204
–
1,823
296
–
46,820
Madawaska—Restigouche NB
MOD
Con
Lib
20,778
55.7%
11,108
29.8%
74.0%
20,778
6,151
9,670
–
707
–
–
37,306
Miramichi—Grand Lake NB
MOD
Con
Lib
17,202
47.3%
4,726
13.0%
75.8%
17,202
12,476
5,588
–
1,098
–
–
36,364
Moncton—Riverview—Dieppe NB
MOD
Con
Lib
30,054
57.8%
18,886
36.3%
72.7%
30,054
11,168
8,420
–
2,399
–
–
52,041
New Brunswick Southwest NB
MOD
Con
Lib
16,656
43.9%
2,031
5.4%
73.7%
16,656
14,625
4,768
–
1,877
–
–
37,926
Saint John—Rothesay NB
MOD
Con
Lib
20,634
48.8%
7,719
18.3%
68.8%
20,634
12,915
7,411
–
1,321
–
–
42,281
Tobique—Mactaquac NB
MOD
Con
Lib
17,909
46.6%
3,684
9.6%
71.4%
17,909
14,225
4,334
–
1,959
–
–
38,427
Avalon NL
CHG
Con
Lib
23,528
55.9%
16,027
38.1%
61.7%
23,528
4,670
6,075
–
228
7,501
84
42,086
Bonavista—Burin—Trinity NL
MOD
Lib
Lib
28,704
81.8%
25,170
71.7%
56.5%
28,704
3,534
2,557
–
297
–
–
35,092
Coast of Bays—Central—Notre Dame NL
MOD
Lib
Lib
26,523
74.8%
20,044
56.5%
55.4%
26,523
6,479
2,175
–
271
–
–
35,448
Labrador NL
ORG
Con
Lib
8,878
71.8%
7,099
57.4%
62.0%
8,878
1,716
1,779
–
–
–
–
12,373
Long Range Mountains NL
MOD
Lib
Lib
30,889
73.9%
25,804
61.7%
58.3%
30,889
5,085
4,739
–
1,111
–
–
41,824
St. John's East NL
MOD
NDP
Lib
20,974
46.7%
646
1.4%
67.9%
20,974
2,938
20,328
–
500
–
140
44,880
St. John's South—Mount Pearl NL
MOD
NDP
Lib
25,922
57.9%
9,455
21.1%
66.5%
25,922
2,047
16,467
–
365
–
–
44,801
Cape Breton—Canso NS
MOD
Lib
Lib
32,163
74.4%
25,917
59.9%
71.6%
32,163
6,246
3,547
–
1,281
–
–
43,237
Central Nova NS
MOD
Con
Lib
25,909
58.5%
14,491
32.7%
73.4%
25,909
11,418
4,532
–
1,834
570
–
44,263
Cumberland—Colchester NS
MOD
Con
Lib
29,527
63.7%
17,270
37.3%
71.0%
29,527
12,257
2,647
–
1,650
251
–
46,332
Dartmouth—Cole Harbour NS
MOD
NDP
Lib
30,407
58.2%
17,650
33.8%
71.2%
30,407
7,331
12,757
–
1,775
–
–
52,270
Halifax NS
MOD
NDP
Lib
27,431
51.7%
8,269
15.6%
72.6%
27,431
4,564
19,162
–
1,745
–
130
53,032
Halifax West NS
MOD
Lib
Lib
34,377
68.6%
26,540
53.0%
71.3%
34,377
7,837
5,894
–
1,971
–
–
50,079
Kings—Hants NS
ORG
Lib
Lib
33,026
70.7%
24,349
52.2%
69.8%
33,026
8,677
2,998
–
1,569
232
184
46,686
Sackville—Preston—Chezzetcook NS
MOD
NDP
Lib
23,161
48.0%
6,548
13.6%
71.3%
23,161
7,186
16,613
–
1,341
–
–
48,301
South Shore—St. Margarets NS
MOD
Con
Lib
30,045
56.9%
18,140
34.4%
69.6%
30,045
11,905
8,883
–
1,534
257
151
52,775
Sydney—Victoria NS
ORG
Lib
Lib
29,995
73.2%
24,644
60.1%
68.7%
29,995
4,360
5,351
–
1,026
–
242
40,974
West Nova NS
ORG
Con
Lib
28,775
63.0%
16,859
36.9%
68.5%
28,775
11,916
3,084
–
1,904
–
–
45,679
Ajax ON
MOD
Con
Lib
31,458
55.9%
12,084
21.5%
66.3%
31,458
19,374
4,630
–
788
57
56,307
Algoma—Manitoulin—Kapuskasing ON
MOD
NDP
NDP
16,516
39.9%
2,405
5.8%
65.7%
14,111
9,820
16,516
–
927
–
–
41,374
Aurora—Oak Ridges—Richmond Hill ON
NEW
Con
Lib
24,132
47.3%
1,093
2.1%
64.7%
24,132
23,039
2,912
–
654
–
243
50,980
Barrie—Innisfil ON
MOD
Con
Con
22,901
46.4%
4,593
9.3%
64.1%
18,308
22,901
5,812
–
1,991
–
329
49,341
Barrie—Springwater—Oro-Medonte ON
NEW
Con
Con
21,091
41.7%
86
0.2%
66.7%
21,005
21,091
5,202
–
2,648
188
401
50,535
Bay of Quinte ON
MOD
Con
Lib
29,281
50.7%
9,500
16.5%
68.1%
29,281
19,781
7,001
–
1,278
372
–
57,713
Beaches—East York ON
ORG
NDP
Lib
27,458
49.4%
10,345
18.6%
72.0%
27,458
9,124
17,113
–
1,433
297
105
55,530
Brampton Centre ON
NEW
Con
Lib
19,277
48.6%
5,932
15.0%
60.9%
19,277
13,345
5,993
–
844
–
173
39,632
Brampton East ON
CHG
NDP
Lib
23,652
52.3%
13,010
28.8%
65.7%
23,652
10,642
10,400
–
512
–
–
45,206
Brampton North ON
MOD
Con
Lib
23,297
48.4%
7,409
15.4%
65.4%
23,297
15,888
7,946
–
915
–
120
48,166
Brampton South ON
NEW
Con
Lib
23,681
52.1%
7,752
17.1%
62.6%
23,681
15,929
4,843
–
1,011
–
–
45,464
Brampton West ON
MOD
Con
Lib
24,256
55.9%
11,188
25.8%
60.6%
24,256
13,068
5,400
–
674
–
–
43,398
Brantford—Brant ON
MOD
Con
Con
25,874
40.9%
6,452
10.2%
65.2%
19,422
25,874
15,715
–
1,582
164
515
63,272
Bruce—Grey—Owen Sound ON
ORG
Con
Con
26,297
46.7%
4,418
7.8%
68.5%
21,879
26,297
6,270
–
1,887
–
–
56,333
Burlington ON
MOD
Con
Lib
32,229
46.0%
2,449
3.5%
73.2%
32,229
29,780
6,381
–
1,710
–
–
70,100
Cambridge ON
MOD
Con
Lib
23,024
43.2%
2,411
4.5%
64.1%
23,024
20,613
7,397
–
1,723
474
108
53,339
Carleton ON
NEW
Con
Con
27,762
46.9%
1,849
3.1%
80.1%
25,913
27,762
3,632
–
1,932
–
–
59,239
Chatham-Kent—Leamington ON
MOD
Con
Con
21,677
41.7%
2,326
4.5%
65.5%
19,351
21,677
9,549
–
1,394
–
–
51,971
Davenport ON
ORG
NDP
Lib
21,947
44.3%
1,441
2.9%
67.0%
21,947
5,233
20,506
–
1,530
107
261
49,584
Don Valley East ON
CHG
Lib
Lib
24,048
57.8%
11,893
28.6%
65.8%
24,048
12,155
4,307
–
1,078
–
–
41,588
Don Valley North ON
NEW
Con
Lib
23,494
51.4%
6,215
13.6%
63.1%
23,494
17,279
3,896
–
1,018
–
–
45,687
Don Valley West ON
MOD
Con
Lib
27,472
53.8%
8,266
16.2%
72.2%
27,472
19,206
3,076
–
848
75
409
51,086
Dufferin—Caledon ON
ORG
Con
Con
27,977
46.3%
4,334
7.2%
65.5%
23,643
27,977
4,398
–
4,433
–
–
60,451
Durham ON
MOD
Con
Con
28,967
45.1%
6,018
9.4%
68.5%
22,949
28,967
10,289
–
1,616
–
364
64,185
Eglinton—Lawrence ON
ORG
Con
Lib
27,278
48.9%
3,490
6.3%
71.5%
27,278
23,788
3,505
–
799
–
422
55,792
Elgin—Middlesex—London ON
MOD
Con
Con
28,023
49.2%
10,381
18.2%
68.5%
17,642
28,023
8,771
–
1,783
–
714
56,933
Essex ON
MOD
Con
NDP
25,072
41.4%
3,470
5.7%
65.7%
12,639
21,602
25,072
–
1,141
–
77
60,531
Etobicoke Centre ON
MOD
Con
Lib
32,612
52.8%
9,542
15.4%
70.2%
32,612
23,070
4,886
–
856
–
378
61,802
Etobicoke North ON
MOD
Lib
Lib
26,251
62.4%
16,578
39.4%
60.5%
26,251
9,673
5,220
–
524
164
232
42,064
Etobicoke—Lakeshore ON
MOD
Con
Lib
34,638
53.7%
13,706
21.2%
69.0%
34,638
20,932
7,030
–
1,507
–
401
64,508
Flamborough—Glanbrook ON
NEW
Con
Con
24,137
43.5%
2,409
4.3%
70.2%
21,728
24,137
7,779
–
1,866
–
–
55,510
Glengarry—Prescott—Russell ON
MOD
Con
Lib
34,189
53.3%
10,822
16.9%
75.1%
34,189
23,367
5,087
–
1,153
–
377
64,173
Guelph ON
ORG
Lib
Lib
34,303
49.1%
15,896
22.8%
71.3%
34,303
18,407
8,392
–
7,909
–
857
69,868
Haldimand—Norfolk ON
MOD
Con
Con
24,714
44.1%
4,227
7.5%
67.7%
20,487
24,714
7,625
–
1,857
423
884
55,990
Haliburton—Kawartha Lakes—Brock ON
MOD
Con
Con
27,718
44.8%
8,084
13.1%
67.6%
19,634
27,718
12,012
–
2,470
–
–
61,834
Hamilton Centre ON
MOD
NDP
NDP
18,719
45.6%
5,001
12.2%
59.4%
13,718
6,018
18,719
–
1,778
186
664
41,083
Hamilton East—Stoney Creek ON
MOD
NDP
Lib
19,622
39.0%
3,157
6.3%
62.8%
19,622
12,715
16,465
–
1,305
–
225
50,332
Hamilton Mountain ON
MOD
NDP
NDP
18,146
35.9%
1,213
2.4%
65.6%
16,933
12,991
18,146
–
1,283
–
1,201
50,554
Hamilton West—Ancaster—Dundas ON
MOD
Con
Lib
29,694
47.7%
9,873
15.9%
72.5%
29,694
19,821
10,131
–
2,633
–
–
62,279
Hastings—Lennox and Addington ON
NEW
Con
Lib
21,104
42.4%
225
0.5%
68.5%
21,104
20,879
6,348
–
1,466
–
–
49,797
Humber River—Black Creek ON
ORG
Lib
Lib
23,995
66.9%
16,767
46.8%
57.5%
23,995
7,228
3,851
–
584
–
201
35,859
Huron—Bruce ON
ORG
Con
Con
26,174
44.9%
3,045
5.2%
72.4%
23,129
26,174
7,544
–
1,398
–
–
58,245
Kanata—Carleton ON
MOD
Con
Lib
32,477
51.3%
7,648
12.1%
79.0%
32,477
24,829
4,313
–
1,704
–
–
63,323
Kenora ON
MOD
Con
Lib
10,918
35.5%
498
1.6%
69.7%
10,918
8,751
10,420
–
501
162
–
30,752
King—Vaughan ON
NEW
Con
Lib
25,908
47.4%
1,738
3.2%
63.8%
25,908
24,170
3,571
–
1,037
–
–
54,686
Kingston and the Islands ON
MOD
Lib
Lib
36,421
55.4%
21,493
32.7%
70.3%
36,421
14,928
11,185
–
2,933
–
305
65,772
Kitchener Centre ON
MOD
Con
Lib
25,504
48.8%
9,632
18.4%
67.5%
25,504
15,872
8,680
–
1,597
–
627
52,280
Kitchener South—Hespeler ON
NEW
Con
Lib
20,215
42.3%
2,671
5.6%
65.9%
20,215
17,544
7,440
–
1,767
–
863
47,829
Kitchener—Conestoga ON
MOD
Con
Con
20,649
43.3%
251
0.5%
69.3%
20,398
20,649
4,653
–
1,314
–
685
47,699
Lambton—Kent—Middlesex ON
MOD
Con
Con
28,300
50.2%
11,708
20.8%
69.7%
16,592
28,300
9,598
–
1,873
–
–
56,363
Lanark—Frontenac—Kingston ON
MOD
Con
Con
27,399
47.9%
8,074
14.1%
72.3%
19,325
27,399
8,073
–
2,025
–
418
57,240
Leeds—Grenville—Thousand Islands and Rideau Lakes ON
ORG
Con
Con
26,738
47.4%
3,850
6.8%
71.1%
22,888
26,738
4,722
–
2,088
–
–
56,436
London North Centre ON
MOD
Con
Lib
32,427
50.5%
12,437
19.4%
69.4%
32,427
19,990
9,423
–
2,286
–
145
64,271
London West ON
MOD
Con
Lib
31,167
45.8%
7,131
10.5%
73.3%
31,167
24,036
10,087
–
1,918
–
819
68,027
London—Fanshawe ON
MOD
NDP
NDP
20,684
37.8%
3,470
6.3%
63.0%
17,214
14,891
20,684
–
1,604
352
–
54,745
Markham—Stouffville ON
MOD
Con
Lib
29,416
49.2%
3,851
6.4%
68.2%
29,416
25,565
3,647
–
1,145
–
–
59,773
Markham—Thornhill ON
NEW
Lib
Lib
23,878
55.7%
10,029
23.4%
60.8%
23,878
13,849
4,595
–
535
–
–
42,857
Markham—Unionville ON
MOD
Con
Con
24,605
49.4%
3,009
6.0%
60.4%
21,596
24,605
2,528
–
1,110
–
–
49,839
Milton ON
NEW
Con
Con
22,378
45.4%
2,438
4.9%
68.5%
19,940
22,378
5,366
–
1,131
–
493
49,308
Mississauga Centre ON
NEW
Con
Lib
28,372
54.7%
10,941
21.1%
62.3%
28,372
17,431
4,920
–
1,129
–
–
51,852
Mississauga East—Cooksville ON
MOD
Con
Lib
28,154
54.2%
9,801
18.9%
63.1%
28,154
18,353
4,481
–
766
–
163
51,917
Mississauga—Erin Mills ON
MOD
Con
Lib
27,520
49.7%
5,804
10.5%
66.9%
27,520
21,716
5,206
–
905
–
–
55,347
Mississauga—Lakeshore ON
MOD
Con
Lib
28,279
47.7%
3,844
6.5%
68.7%
28,279
24,435
4,735
–
1,397
–
427
59,273
Mississauga—Malton ON
MOD
Con
Lib
26,165
59.1%
14,464
32.7%
59.1%
26,165
11,701
5,450
–
737
203
–
44,256
Mississauga—Streetsville ON
MOD
Con
Lib
26,792
47.8%
4,171
7.4%
67.4%
26,792
22,621
5,040
–
1,293
–
253
55,999
Nepean ON
MOD
Con
Lib
34,017
52.4%
10,575
16.3%
77.5%
34,017
23,442
5,324
–
1,513
551
41
64,888
Newmarket—Aurora ON
MOD
Con
Lib
25,508
45.2%
1,451
2.6%
68.1%
25,508
24,057
4,806
–
1,331
–
762
56,464
Niagara Centre ON
MOD
NDP
Lib
19,513
35.7%
2,295
4.2%
65.6%
19,513
16,248
17,218
–
1,316
–
387
54,682
Niagara Falls ON
ORG
Con
Con
27,235
42.1%
4,917
7.6%
63.0%
22,318
27,235
13,525
–
1,633
–
–
64,711
Niagara West ON
MOD
Con
Con
24,732
48.8%
8,151
16.1%
73.3%
16,581
24,732
5,802
–
1,511
–
2,031
50,657
Nickel Belt ON
MOD
NDP
Lib
21,021
42.8%
2,465
5.0%
67.1%
21,021
8,221
18,556
–
1,217
–
98
49,113
Nipissing—Timiskaming ON
MOD
Lib
Lib
25,357
51.9%
11,032
22.6%
68.3%
25,357
14,325
7,936
–
1,257
–
–
48,875
Northumberland—Peterborough South ON
MOD
Con
Lib
27,043
42.5%
1,878
3.0%
71.3%
27,043
25,165
9,411
–
1,990
–
–
63,609
Oakville ON
ORG
Con
Lib
31,956
49.4%
4,459
6.9%
73.4%
31,956
27,497
3,830
–
1,420
–
–
64,703
Oakville North—Burlington ON
MOD
Con
Lib
28,415
46.7%
2,073
3.4%
71.2%
28,415
26,342
4,405
–
968
–
666
60,796
Orléans ON
MOD
Con
Lib
46,542
59.7%
22,721
29.1%
80.6%
46,542
23,821
6,215
–
1,410
–
–
77,988
Oshawa ON
MOD
Con
Con
23,162
38.2%
3,823
6.3%
63.2%
16,588
23,162
19,339
–
1,522
–
75
60,686
Ottawa Centre ON
MOD
NDP
Lib
32,211
42.7%
3,113
4.1%
80.0%
32,211
10,943
29,098
–
2,246
–
1,002
75,500
Ottawa South ON
MOD
Lib
Lib
38,831
60.1%
23,120
35.8%
73.6%
38,831
15,711
7,480
–
1,888
–
739
64,649
Ottawa West—Nepean ON
MOD
Con
Lib
35,199
55.9%
16,306
25.9%
74.8%
35,199
18,893
6,195
–
1,772
–
854
62,913
Ottawa—Vanier ON
MOD
Lib
Lib
36,474
57.6%
24,280
38.3%
73.6%
36,474
12,109
12,194
–
1,947
–
631
63,355
Oxford ON
MOD
Con
Con
25,966
45.7%
7,667
13.5%
67.9%
18,299
25,966
9,406
–
2,004
–
1,175
56,850
Parkdale—High Park ON
ORG
NDP
Lib
24,623
42.0%
1,057
1.8%
73.3%
24,623
7,641
23,566
–
1,743
93
901
58,567
Parry Sound-Muskoka ON
ORG
Con
Con
22,206
43.3%
2,269
4.4%
67.6%
19,937
22,206
5,183
–
3,704
–
249
51,279
Perth Wellington ON
ORG
Con
Con
22,255
42.9%
2,775
5.4%
68.0%
19,480
22,255
7,756
–
1,347
219
794
51,851
Peterborough—Kawartha ON
MOD
Con
Lib
29,159
43.8%
5,824
8.8%
71.6%
29,159
23,335
12,437
–
1,480
–
131
66,542
Pickering—Uxbridge ON
MOD
Con
Lib
29,757
50.3%
7,166
12.1%
69.0%
29,757
22,591
5,446
–
1,365
–
–
59,159
Renfrew—Nipissing—Pembroke ON
ORG
Con
Con
26,195
45.8%
7,529
13.2%
72.7%
18,666
26,195
4,893
–
1,105
6,300
–
57,159
Richmond Hill ON
MOD
Con
Lib
23,032
46.9%
1,757
3.6%
61.1%
23,032
21,275
3,950
–
856
–
–
49,113
St. Catharines ON
MOD
Con
Lib
24,870
43.2%
3,233
5.6%
67.7%
24,870
21,637
9,511
–
1,488
–
85
57,591
Sarnia—Lambton ON
ORG
Con
Con
22,565
38.8%
4,463
7.7%
71.8%
15,853
22,565
18,102
–
1,605
–
–
58,125
Sault Ste. Marie ON
MOD
Con
Lib
19,582
44.8%
5,967
13.6%
68.3%
19,582
13,615
9,543
–
934
–
83
43,757
Scarborough Centre ON
MOD
Con
Lib
22,753
50.5%
8,048
17.9%
63.2%
22,753
14,705
5,227
–
960
–
1,384
45,029
Scarborough North ON
MOD
NDP
Lib
18,904
48.2%
8,167
20.8%
60.0%
18,904
10,737
8,648
–
579
–
320
39,188
Scarborough Southwest ON
MOD
NDP
Lib
25,586
52.5%
14,012
28.7%
66.7%
25,586
10,347
11,574
–
1,259
–
–
48,766
Scarborough—Agincourt ON
MOD
Lib
Lib
21,587
51.9%
5,785
13.9%
59.4%
21,587
15,802
3,263
–
570
–
334
41,556
Scarborough-Guildwood ON
MOD
Lib
Lib
25,167
60.0%
14,059
33.5%
64.6%
25,167
11,108
4,720
–
606
175
141
41,917
Scarborough—Rouge Park ON
NEW
Lib
Lib
29,913
60.2%
16,326
32.9%
68.0%
29,913
13,587
5,145
–
1,010
–
–
49,655
Simcoe North ON
MOD
Con
Con
24,836
43.5%
2,118
3.7%
65.9%
22,718
24,836
6,037
–
2,543
618
319
57,071
Simcoe—Grey ON
MOD
Con
Con
30,612
46.6%
5,260
8.0%
67.3%
25,352
30,612
6,332
–
2,923
–
528
65,747
Spadina—Fort York ON
MOD
NDP
Lib
30,141
54.7%
15,094
27.4%
69.3%
30,141
8,673
15,047
–
1,137
–
150
55,148
Stormont—Dundas—South Glengarry ON
ORG
Con
Con
27,091
51.1%
6,639
12.5%
67.2%
20,452
27,091
4,332
–
1,191
–
–
53,066
Sudbury ON
MOD
NDP
Lib
23,534
47.4%
9,741
19.6%
68.2%
23,534
10,473
13,793
–
1,509
218
102
49,629
Thornhill ON
MOD
Con
Con
31,911
58.6%
13,516
24.8%
67.1%
18,395
31,911
2,814
–
627
–
744
54,491
Thunder Bay—Rainy River ON
MOD
NDP
Lib
18,523
44.0%
6,040
14.4%
66.3%
18,523
8,876
12,483
–
2,201
–
–
42,083
Thunder Bay—Superior North ON
MOD
NDP
Lib
20,069
45.0%
9,730
21.8%
68.7%
20,069
7,775
10,339
–
6,155
270
–
44,608
Timmins-James Bay ON
MOD
NDP
NDP
15,974
42.9%
3,034
8.1%
61.1%
12,940
7,605
15,974
–
752
–
–
37,271
Toronto Centre ON
MOD
Lib
Lib
29,297
57.9%
15,830
31.3%
69.3%
29,297
6,167
13,467
–
1,315
147
209
50,602
Toronto—Danforth ON
ORG
NDP
Lib
23,531
42.3%
1,206
2.2%
71.1%
23,531
5,478
22,325
–
2,618
–
1,629
55,581
Toronto—St. Paul's ON
MOD
Lib
Lib
31,481
55.3%
16,105
28.3%
72.5%
31,481
15,376
8,386
–
1,729
–
–
56,972
University—Rosedale ON
NEW
NDP
Lib
27,849
49.8%
11,861
21.2%
72.8%
27,849
9,790
15,988
–
1,641
–
657
55,925
Vaughan—Woodbridge ON
MOD
Con
Lib
23,041
48.7%
2,295
4.9%
63.9%
23,041
20,746
2,198
–
597
–
716
47,298
Waterloo ON
MOD
Con
Lib
29,752
49.7%
10,434
17.4%
73.2%
29,752
19,318
8,928
–
1,713
–
138
59,849
Wellington—Halton Hills ON
ORG
Con
Con
32,482
50.9%
9,203
14.4%
71.0%
23,279
32,482
5,321
–
2,547
–
183
63,812
Whitby ON
MOD
Con
Lib
29,003
45.0%
1,849
2.9%
70.0%
29,003
27,154
6,677
–
1,403
279
–
64,516
Willowdale ON
MOD
Con
Lib
24,519
53.4%
7,529
16.4%
60.6%
24,519
16,990
3,203
–
1,025
216
–
45,953
Windsor West ON
MOD
NDP
NDP
24,085
51.3%
12,243
26.1%
54.8%
11,842
9,734
24,085
–
1,083
–
161
46,905
Windsor—Tecumseh ON
MOD
NDP
NDP
23,215
43.5%
8,559
16.0%
61.1%
14,177
14,656
23,215
–
1,047
–
249
53,344
York Centre ON
MOD
Con
Lib
20,131
46.9%
1,238
2.9%
65.7%
20,131
18,893
3,148
–
772
–
–
42,944
York South—Weston ON
ORG
NDP
Lib
20,093
46.0%
6,812
15.6%
61.1%
20,093
8,399
13,281
–
892
–
1,041
43,706
York—Simcoe ON
MOD
Con
Con
24,058
50.2%
5,975
12.5%
63.3%
18,083
24,058
4,255
–
1,483
–
–
47,879
Cardigan PE
ORG
Lib
Lib
14,621
65.0%
10,989
48.9%
78.2%
14,621
3,632
2,503
–
1,434
–
295
22,485
Charlottetown PE
ORG
Lib
Lib
11,910
56.3%
7,013
33.1%
75.6%
11,910
3,136
4,897
–
1,222
–
–
21,165
Egmont PE
ORG
Con
Lib
10,521
49.3%
4,336
20.3%
77.0%
10,521
6,185
4,097
–
559
–
–
21,362
Malpeque PE
ORG
Lib
Lib
13,950
62.1%
10,003
44.5%
78.9%
13,950
3,947
2,509
–
2,066
–
–
22,472
Abitibi—Baie-James—Nunavik—Eeyou QC
MOD
NDP
NDP
12,778
37.0%
1,684
4.9%
55.2%
11,094
3,211
12,778
6,398
779
–
258
34,518
Abitibi—Témiscamingue QC
MOD
NDP
NDP
20,636
41.5%
5,903
11.9%
60.8%
14,733
3,425
20,636
9,651
859
–
425
49,729
Ahuntsic-Cartierville QC
CHG
Lib
Lib
26,026
46.8%
9,342
16.8%
67.5%
26,026
4,051
16,684
7,346
1,175
–
285
55,567
Alfred-Pellan QC
MOD
NDP
Lib
24,557
44.5%
11,332
20.5%
71.1%
24,557
6,259
13,225
9,836
1,089
203
–
55,169
Argenteuil—La Petite-Nation QC
MOD
NDP
Lib
22,093
43.3%
9,443
18.5%
65.5%
22,093
5,680
12,650
9,525
1,118
–
–
51,066
Avignon—La Mitis—Matane—Matapédia QC
MOD
BQ
Lib
14,378
39.5%
6,737
18.5%
60.4%
14,378
2,228
7,340
7,641
365
–
4,404
36,356
Beauce QC
MOD
Con
Con
32,910
58.9%
20,468
36.6%
66.0%
12,442
32,910
5,443
4,144
943
–
–
55,882
Beauport—Côte-de-Beaupré—Île d’Orléans—Charlevoix QC
MOD
NDP
Con
16,903
33.5%
3,347
6.6%
67.0%
13,556
16,903
9,306
9,650
859
–
182
50,456
Beauport—Limoilou QC
MOD
NDP
Con
15,461
30.6%
2,580
5.1%
65.4%
12,854
15,461
12,881
7,467
1,220
–
675
50,558
Bécancour—Nicolet—Saurel QC
ORG
BQ
BQ
20,871
40.0%
8,205
15.7%
67.5%
12,666
5,955
11,531
20,871
1,182
–
–
52,205
Bellechasse—Les Etchemins—Lévis QC
MOD
Con
Con
31,872
50.9%
18,911
30.2%
68.4%
12,961
31,872
8,516
7,217
2,032
–
–
62,598
Beloeil—Chambly QC
MOD
NDP
NDP
20,641
31.1%
1,147
1.7%
73.9%
19,494
6,173
20,641
18,387
1,498
–
245
66,438
Berthier—Maskinongé QC
MOD
NDP
NDP
22,942
42.2%
8,905
16.4%
66.6%
11,032
5,548
22,942
14,037
847
–
–
54,406
Bourassa QC
MOD
Lib
Lib
22,234
54.1%
15,185
36.9%
59.1%
22,234
3,819
6,144
7,049
886
669
328
41,129
Brome—Missisquoi QC
MOD
NDP
Lib
25,744
43.9%
11,361
19.4%
69.8%
25,744
6,724
14,383
10,252
1,377
–
195
58,675
Brossard—Saint-Lambert QC
MOD
NDP
Lib
28,818
50.3%
14,743
25.7%
69.0%
28,818
7,215
14,075
6,071
1,081
–
–
57,260
Charlesbourg—Haute-Saint-Charles QC
MOD
NDP
Con
24,608
42.2%
11,083
19.0%
69.7%
13,525
24,608
11,690
7,177
1,256
–
–
58,256
Châteauguay—Lacolle QC
MOD
NDP
Lib
20,245
39.1%
7,630
14.7%
69.2%
20,245
5,805
11,986
12,615
982
–
149
51,782
Chicoutimi—Le Fjord QC
MOD
NDP
Lib
13,619
31.1%
600
1.4%
66.7%
13,619
7,270
13,019
8,990
907
–
–
43,805
Compton—Stanstead QC
MOD
NDP
Lib
20,582
36.9%
5,282
9.5%
68.8%
20,582
6,978
15,300
11,551
1,085
–
315
55,811
Dorval—Lachine—LaSalle QC
MOD
NDP
Lib
29,974
54.9%
18,205
33.3%
64.4%
29,974
6,049
11,769
5,338
1,245
230
–
54,605
Drummond QC
ORG
NDP
NDP
15,833
30.5%
2,040
3.9%
65.2%
13,793
9,221
15,833
11,862
1,270
–
–
51,979
Gaspésie—Les Îles-de-la-Madeleine QC
CHG
BQ
Lib
15,345
38.7%
2,460
6.2%
60.8%
15,345
2,398
12,885
8,289
400
–
300
39,617
Gatineau QC
MOD
NDP
Lib
31,076
53.8%
15,724
27.2%
69.1%
31,076
4,733
15,352
5,455
942
148
94
57,800
Hochelaga QC
MOD
NDP
NDP
16,034
30.9%
500
1.0%
63.5%
15,534
3,555
16,034
14,389
1,654
–
738
51,904
Honoré-Mercier QC
MOD
NDP
Lib
29,211
56.5%
20,733
40.1%
66.2%
29,211
6,226
8,478
6,680
814
–
249
51,658
Hull—Aylmer QC
MOD
NDP
Lib
28,478
51.4%
11,006
19.9%
70.4%
28,478
4,278
17,472
3,625
1,035
160
392
55,440
Joliette QC
MOD
NDP
BQ
18,875
33.3%
2,880
5.1%
67.0%
15,995
5,705
14,566
18,875
1,335
–
213
56,689
Jonquière QC
MOD
NDP
NDP
14,039
29.2%
339
0.7%
67.0%
13,700
8,124
14,039
11,202
656
–
382
48,103
La Pointe-de-l'Île QC
MOD
NDP
BQ
18,545
33.6%
2,768
5.0%
66.2%
15,777
4,408
14,777
18,545
1,130
–
493
55,226
La Prairie QC
NEW
NDP
Lib
20,993
36.5%
5,886
10.2%
71.0%
20,993
6,859
13,174
15,107
1,235
–
204
57,572
Lac-Saint-Jean QC
MOD
Con
Con
18,393
33.3%
2,658
4.8%
65.8%
10,193
18,393
15,735
10,152
806
–
–
55,279
Lac-Saint-Louis QC
MOD
Lib
Lib
39,965
64.1%
29,108
46.7%
72.9%
39,965
10,857
7,997
1,681
1,812
–
–
62,312
LaSalle—Émard—Verdun QC
MOD
NDP
Lib
23,603
43.9%
8,037
14.9%
64.8%
23,603
3,713
15,566
9,164
1,717
–
–
53,763
Laurentides—Labelle QC
ORG
NDP
Lib
20,277
32.1%
1,485
2.4%
66.3%
20,277
6,209
16,644
18,792
1,251
–
–
63,173
Laurier—Sainte-Marie QC
MOD
NDP
NDP
20,929
38.3%
5,230
9.6%
65.0%
12,938
2,242
20,929
15,699
1,904
160
809
54,681
Laval—Les Îles QC
MOD
NDP
Lib
25,857
47.7%
15,147
27.9%
66.6%
25,857
9,811
10,710
6,731
921
–
175
54,205
Lévis—Lotbinière QC
MOD
Con
Con
31,357
50.1%
17,795
28.4%
72.8%
13,562
31,357
9,246
7,163
1,124
–
136
62,588
Longueuil—Charles-LeMoyne QC
MOD
NDP
Lib
18,301
35.4%
4,327
8.4%
62.8%
18,301
4,961
12,468
13,974
1,510
–
493
51,707
Longueuil—Saint-Hubert QC
MOD
NDP
NDP
18,171
31.2%
703
1.2%
68.8%
17,468
5,087
18,171
15,873
1,447
–
153
58,199
Louis-Hébert QC
MOD
NDP
Lib
21,516
34.8%
4,727
7.7%
76.6%
21,516
16,789
12,850
8,900
1,561
–
128
61,744
Louis-Saint-Laurent QC
MOD
NDP
Con
32,637
50.5%
18,785
29.0%
70.9%
13,852
32,637
10,296
6,688
1,210
–
–
64,683
Manicouagan QC
MOD
NDP
BQ
17,338
41.3%
4,995
11.9%
56.7%
12,343
4,317
7,359
17,338
673
–
–
42,030
Marc-Aurèle-Fortin QC
MOD
NDP
Lib
22,323
40.9%
9,496
17.4%
72.4%
22,323
6,498
12,827
11,820
1,057
–
–
54,525
Mégantic—L'Érable QC
MOD
Con
Con
16,749
35.4%
3,441
7.3%
67.3%
13,308
16,749
10,386
5,838
1,006
–
–
47,287
Mirabel QC
NEW
NDP
BQ
18,710
31.5%
837
1.4%
68.9%
15,514
6,020
17,873
18,710
1,301
–
–
59,418
Montarville QC
MOD
NDP
Lib
18,848
32.5%
2,388
4.1%
77.7%
18,848
6,284
14,296
16,460
1,388
–
641
57,917
Montcalm QC
MOD
NDP
BQ
19,405
36.6%
4,921
9.3%
64.7%
14,484
5,093
12,431
19,405
976
–
620
53,009
Montmagny—L'Islet—Kamouraska—Rivière-du-Loup QC
ORG
NDP
Con
14,274
29.0%
272
0.6%
63.6%
14,002
14,274
11,918
7,939
823
–
287
49,243
Mount Royal QC
MOD
Lib
Lib
24,187
50.3%
5,986
12.%
65.1%
24,187
18,201
3,884
908
747
–
124
48,051
Notre-Dame-de-Grâce—Westmount QC
MOD
Lib
Lib
29,755
57.7%
18,526
35.9%
65.0%
29,755
7,414
11,229
1,282
1,581
151
181
51,593
Outremont QC
MOD
NDP
NDP
19,242
44.1%
4,645
10.6%
61.9%
14,597
4,159
19,242
3,668
1,575
–
378
43,619
Papineau QC
MOD
Lib
Lib
26,391
52.0%
13,259
26.1%
65.0%
26,391
2,390
13,132
6,182
1,443
768
465
50,770
Pierre-Boucher—Les Patriotes—Verchères QC
MOD
NDP
BQ
17,007
28.6%
213
0.4%
76.3%
16,794
6,079
14,454
17,007
5,056
–
–
59,390
Pierrefonds—Dollard QC
ORG
NDP
Lib
34,319
58.7%
22,625
38.7%
69.0%
34,319
11,694
9,584
–
2,043
–
–
58,505
Pontiac QC
MOD
NDP
Lib
34,154
54.5%
20,064
32.0%
71.8%
34,154
8,716
14,090
4,337
1,089
–
239
62,625
Portneuf—Jacques-Cartier QC
ORG
NDP
Con
27,290
44.0%
13,604
21.9%
71.1%
13,322
27,290
13,686
6,665
1,096
–
–
62,059
Québec QC
MOD
NDP
Lib
15,566
28.9%
1,000
1.9%
68.7%
15,566
11,737
14,566
10,153
1,570
–
275
53,867
Repentigny QC
MOD
NDP
BQ
22,618
34.7%
4,820
7.4%
72.1%
17,798
7,053
15,167
22,618
1,242
–
1,333
65,211
Richmond—Arthabaska QC
MOD
BQ
Con
18,505
31.6%
4,042
6.9%
69.3%
14,463
18,505
14,213
10,068
984
–
384
58,617
Rimouski-Neigette—Témiscouata—Les Basques QC
ORG
NDP
NDP
19,374
43.1%
6,780
15.1%
64.7%
12,594
3,363
19,374
8,673
669
–
273
44,946
Rivière-des-Mille-Îles QC
MOD
NDP
Lib
18,787
32.4%
1,676
2.9%
72.3%
18,787
6,099
17,111
14,755
1,136
158
–
58,046
Rivière-du-Nord QC
MOD
NDP
BQ
18,157
32.0%
1,080
1.9%
64.4%
14,933
4,793
17,077
18,157
1,436
–
261
56,657
Rosemont—La Petite-Patrie QC
MOD
NDP
NDP
28,672
49.2%
16,389
28.1%
69.7%
12,068
2,510
28,672
12,283
1,783
–
1,019
58,335
Saint-Hyacinthe—Bagot QC
ORG
NDP
NDP
15,578
28.7%
598
1.1%
68.6%
14,980
9,098
15,578
13,200
1,243
270
–
54,369
Saint-Jean QC
ORG
NDP
Lib
20,022
33.2%
2,467
4.1%
69.6%
20,022
6,549
17,555
14,979
1,281
–
–
60,386
Saint-Laurent QC
MOD
Lib
Lib
24,832
61.6%
16,965
42.1%
58.9%
24,832
7,867
4,646
1,879
977
–
129
40,330
Saint-Léonard—Saint-Michel QC
MOD
Lib
Lib
28,826
64.7%
22,215
49.9%
58.9%
28,826
4,957
6,611
3,204
805
–
128
44,531
Saint-Maurice—Champlain QC
MOD
NDP
Lib
24,475
41.5%
12,230
20.7%
65.1%
24,475
9,592
12,245
11,295
1,144
–
196
58,947
Salaberry—Suroît QC
MOD
NDP
NDP
18,726
30.4 %
771
1.3%
67.5%
17,955
6,132
18,726
17,452
867
219
184
61,535
Shefford QC
MOD
NDP
Lib
22,957
39.0%
9,012
15.3%
68.0%
22,957
7,529
13,945
13,092
1,397
–
–
58,920
Sherbrooke QC
MOD
NDP
NDP
21,410
37.4%
4,339
7.6%
66.3%
17,071
5,391
21,410
11,717
1,143
303
265
57,300
Terrebonne QC
MOD
NDP
BQ
19,238
33.0%
2,922
5.0%
70.5%
16,316
6,615
14,928
19,238
1,016
–
171
58,284
Thérèse-De Blainville QC
NEW
NDP
Lib
18,281
32.5%
3,043
5.4%
72.1%
18,281
7,000
14,022
15,238
1,352
–
355
56,248
Trois-Rivières QC
MOD
NDP
NDP
19,193
31.8%
969
1.6%
67.2%
18,224
11,231
19,193
10,249
1,032
–
360
60,289
Vaudreuil—Soulanges QC
MOD
NDP
Lib
30,550
46.6%
15,923
24.3%
73.0%
30,550
9,858
14,627
9,858
1,445
–
–
65,528
Ville-Marie—Le Sud-Ouest—Île-des-Sœurs QC
MOD
NDP
Lib
25,491
50.8%
13,734
27.4%
59.0%
25,491
5,948
11,757
4,307
2,398
–
263
50,164
Vimy QC
MOD
NDP
Lib
25,082
46.2%
13,691
25.2%
64.1%
25,082
7,262
11,391
9,068
1,280
–
260
54,343
Battlefords—Lloydminster SK
MOD
Con
Con
20,547
61.0%
14,617
43.4%
66.5%
5,550
20,547
5,930
–
575
1,076
–
33,678
Carlton Trail—Eagle Creek SK
MOD
Con
Con
26,004
64.7%
18,505
46.1%
71.8%
5,774
26,004
7,499
–
902
–
–
40,179
Cypress Hills—Grasslands SK
MOD
Con
Con
25,050
69.2%
19,669
54.3%
71.4%
5,381
25,050
4,783
–
993
–
–
36,207
Desnethé—Missinippi—Churchill River SK
MOD
Con
NDP
10,319
34.2%
82
0.3%
64.7%
10,237
9,105
10,319
–
552
–
–
30,213
Moose Jaw—Lake Centre—Lanigan SK
MOD
Con
Con
23,273
55.5%
13,295
31.7%
72.2%
7,545
23,273
9,978
–
961
–
208
41,965
Prince Albert SK
MOD
Con
Con
19,673
49.8%
8,429
21.3%
68.5%
7,832
19,673
11,244
–
761
–
–
39,510
Regina—Lewvan SK
CHG
NDP
NDP
16,843
35.2%
132
0.3%
74.6%
13,143
16,711
16,843
–
839
–
298
47,834
Regina—Qu'Appelle SK
MOD
Con
Con
16,486
44.7%
5,342
14.5%
68.3%
8,401
16,486
11,144
–
852
–
–
36,883
Regina—Wascana SK
MOD
Lib
Lib
23,552
55.1%
10,621
24.9%
74.6%
23,552
12,931
5,362
–
878
–
–
42,723
Saskatoon West SK
CHG
NDP
NDP
14,921
39.6%
2,520
6.7%
66.4%
9,234
12,401
14,921
–
658
–
501
37,715
Saskatoon—Grasswood SK
MOD
Con
Con
19,166
41.6%
5,257
11.4%
77.5%
12,165
19,166
13,909
–
846
–
–
46,086
Saskatoon—University SK
MOD
Con
Con
18,592
41.5%
4,477
10.0%
76.9%
11,287
18,592
14,115
–
686
–
93
44,773
Souris—Moose Mountain SK
MOD
Con
Con
26,315
70.1%
21,184
56.5%
71.1%
5,076
26,315
5,131
–
994
–
–
37,516
Yorkton—Melville SK
MOD
Con
Con
21,683
59.2%
14,287
39.0%
67.4%
6,504
21,683
7,396
–
1,030
–
–
36,613
Northwest Territories Terr
ORG
NDP
Lib
9,172
48.3%
3,389
17.9%
63.4%
9,172
3,481
5,783
–
537
–
–
18,973
Nunavut Terr
ORG
Con
Lib
5,619
47.1%
2,448
20.5%
59.4%
5,619
2,956
3,171
–
182
–
–
11,928
Yukon Terr
ORG
Con
Lib
10,887
53.7%
5,959
29.4%
75.8%
10,887
4,928
3,943
–
533
–
–
20,291
= application for judicial recount dismissed = judicial recount terminated = results as certified by a judgeResult overview [ edit ]
↓
184
99
44
10
1
Liberal
Conservative
New Democratic
B
G
Summary analysis [ edit ] The disproportionality of parliament in the 2015 election was 12.02 according to the Gallagher Index , mainly in the Liberals' favour.
Elections to the 42nd Parliament of Canada – seats won/lost by party, 2011–2015
Party
2011 (redistributed)
Gain from (loss to)
2015
Lib
Con
NDP
BQ
Grn
Liberal
36
88
58
2
184
Conservative
188
(88)
6
(8)
1
99
New Democratic
109
(58)
8
(6)
(9)
44
Bloc Québécois
4
(2)
(1)
9
10
Green
1
1
Total 338
–
(148)
96
(7)
73
(8)
3
(9)
–
338
Detailed analysis [ edit ] Turnout [ edit ] The election was notable for seeing voter turnout rise across all ages and sexes, and especially significant for the rise in younger voters. In particular, there was an increase of 1.2 million voters among those under the age of 35.[5]
Voter turnout by age and sex, %, 2015 vs 2011[6] [7]
Age
2015
2011
∆%
Total
Male
Female
Total
Male
Female
Total
Male
Female
Canada 66.1
64.1
68.0
58.5
57.3
59.6
18 to 24 years
57.1
53.8
60.5
38.8
36.9
40.9
1st time voters 58.3 54.9 61.9 40.5 38.4 42.8 17.7 16.4 19.1
Not 1st time 55.1 52.0 58.3 37.8 36.0 39.8 17.3 16.0 18.5
25 to 34 years
57.4
54.3
60.5
45.1
42.5
47.7
35 to 44 years
61.9
58.7
65.1
54.5
51.5
47.5
45 to 54 years
66.6
63.6
69.6
64.5
62.1
66.9
55 to 64 years
73.7
71.4
76.0
71.5
70.7
72.2
65 to 74 years
78.8
79.0
78.6
75.1
77.4
73.1
75 years and over
67.4
74.1
62.8
60.3
69.5
54.2
Geographic voting distributions [ edit ] Party summaries [ edit ] Liberals [ edit ] In the previous election, the Liberals were cut down to 34 seats, the fewest they had ever won in their history. It was the first time since the nation's founding that the Liberals had not been either in government or the Official Opposition. They picked up one additional seat in a by-election and one via a floor-crossing.
While the Liberals had been expected to regain much of what they had lost in 2011, they tallied the second-best performance in their history; the 184 seats was bettered only by the 191 they won in 1949 . It was also the most seats that a party had won since the Progressive Conservatives won a record 211 in 1984 .
The Liberal victory came mainly on the strength of a solid performance in the eastern part of the country. They took every seat in Atlantic Canada and Toronto , and won all but one seat in Ottawa . Most notably, they won 40 of Quebec 's 78 seats, mostly on the strength of taking all but five seats in Montreal . It was the first time since 1980 that the Liberals had won the most seats in Quebec.
After going into the election with only four seats west of Ontario, the Liberals had their best showing in Western Canada in more than two decades. They not only took all but one seat in Winnipeg and all but two seats in Vancouver , but won seats in Alberta for the first time since 2004. Notably, they won two seats in Calgary ; they had won only three seats there in their entire history prior to 2015, with their last win dating back to 1968 . They were the only party to win seats in every province.
Conservatives [ edit ] The Conservatives lost 60 seats to become the Official Opposition. They held their own in their heartlands of rural western Canada and central Ontario, and managed a respectable showing in southwestern Ontario and the more rural areas of eastern Ontario. However, they suffered heavy losses in urban southern Ontario, a region which had swung heavily to them in 2011. They lost all of their seats in Toronto itself and all but three in the 905 region . They also lost all of their seats in Winnipeg and Vancouver, as well as Atlantic Canada. It is the first time in decades that there are no centre-right MPs east of Quebec. They did, however, manage to make some gains in francophone areas of Quebec, mostly at the expense of the NDP.
Several members of Harper's cabinet were defeated, including Bernard Valcourt , Leona Aglukkaq , Gail Shea , Chris Alexander , Joe Oliver and Julian Fantino among others.
New Democrats [ edit ] The NDP, the Official Opposition in the previous parliament, fell to third place with 44 seats, losing more than half of their caucus. For the most part, their support bled over to the Liberals, though they lost a few areas of francophone Quebec to the Conservatives and Bloc.
Bloc Québecois [ edit ] The Bloc made a modest recovery after being nearly decimated in 2011, rebounding to 10 seats. However, Gilles Duceppe , who had been the longest-serving party leader in Canada at the time of his defeat in 2011, failed to win back his old seat of Laurier—Sainte-Marie . The party also received a smaller share of the popular vote than in the last election. As such, their gains could be attributable to NDP-Liberal vote splitting in francophone ridings more than a surge in popular support.
Contributing factors to party success [ edit ] The parties had varying degrees of success by region and by socioeconomic factors. An analysis by The Globe and Mail [8]
Party support arising from certain key factors by region in the Canadian general election (2015), as a proportion of the ridings won
Region
Income (Median household)
Unemployment rate
Visible minority population
<$35,810
$35,810–$141,720
>$141,720
Low (4%–6%)
High (9%–22%)
Low (<2.41%)
High (>26.8%)
Atlantic
Quebec
Ontario
Prairies
British Columbia
N/A
The North
Results by province [ edit ]
Party name
BC
AB
SK
MB
ON
QC
NB
NS
PE
NL
YT
NT
NU
Total
Liberal
Seats:
17
4
1
7
80
40
10
11
4
7
1
1
1
184
Vote:
35.2
24.6
23.9
44.6
44.8
35.7
51.6
61.9
58.3
64.5
53.6
48.3
47.2
39.5
Conservative
Seats:
10
29
10
5
33
12
–
–
–
–
–
–
–
99
Vote:
30.0
59.5
48.5
37.3
35.0
16.7
25.3
17.9
19.3
10.3
24.0
18.0
24.8
31.9
New Democratic Party
Seats:
14
1
3
2
8
16
–
–
–
–
–
–
–
44
Vote:
25.9
11.6
25.1
13.8
16.6
25.4
18.3
16.4
16.0
21.0
19.5
30.8
26.5
19.7
Bloc Québécois
Seats:
–
–
–
–
–
10
–
–
–
–
–
–
–
10
Vote:
–
–
–
–
–
19.3
–
–
–
–
–
–
–
4.7
Green
Seats:
1
–
–
–
–
–
–
–
–
–
–
–
–
1
Vote:
8.2
2.5
2.1
3.2
2.9
2.3
4.6
3.4
6.0
1.1
2.9
2.8
1.5
3.4
Independent and no affiliation
Vote:
0.1
0.8
0.2
0.6
0.2
0.1
0.1
0.3
–
2.9
–
–
–
0.2
Total seats
42
34
14
14
121
78
10
11
4
7
1
1
1
338
10 closest ridings [ edit ] Significant results among independent and minor party candidates [ edit ] Those candidates not belonging to a major party, receiving more than 1,000 votes in the election, are listed below:
Significant vote tallies for independent and minor party candidates
Riding
Candidate
Votes
Placed
Avalon NL
█ No AffiliationScott Andrews 7,501
2nd
Avignon—La Mitis—Matane—Matapédia QC
█ Strength in Democracy Jean-François Fortin 4,229
4th
Battlefords—Lloydminster SK
█ Independent Doug Anguish 1,076
4th
Coquitlam—Port Coquitlam BC
█ Libertarian Lewis Clarke Dahlby
1,014
5th
Dauphin—Swan River—Neepawa MB
█ Independent Inky Mark 3,357
4th
New Westminster—Burnaby BC
█ Libertarian Rex Brocki
1,368
5th
Niagara West ON
█ Christian Heritage Harold Jonker
1,234
5th
Oxford ON
█ Christian Heritage Melody Ann Aldred
1,175
5th
Portage—Lisgar MB
█ Christian Heritage Jerome Dondo[a 1]
1,315
5th
(federal electoral district)|Renfrew—Nipissing—Pembroke ON
█ Independent Hector Clouthier 6,300
3rd
Repentigny QC
█ Strength in Democracy Johnathan Cloutier
1,333
5th
St. Albert—Edmonton AB
█ Independent Brent Rathgeber 11,652
3rd
Scarborough Centre ON
█ Libertarian Katerina Androutsos
1,384
4th
Sherwood Park—Fort Saskatchewan AB
█ Independent James Ford[a 2]
1,563
5th
Toronto—Danforth ON
█ Progressive Canadian John Richardson
1,275
5th
York South—Weston ON
█ Libertarian Stephen Lepone
1,041
4th
Retiring & defeated incumbents [ edit ] Notional gains [ edit ] As a result of the 2012 federal electoral redistribution , thirty new ridings were added and many riding boundaries were changed, so several incumbent MPs who ran chose to do so in new ridings. The following table identifies the subsequent nominees in their old ridings and who they lost to.
Effects of redistribution [ edit ] As a result of the 2012 federal electoral redistribution , 31 new ridings were added and two ridings were merged. Boundary changes in eleven other ridings had the effect of revising the first-place ranking from what had occurred in 2011.
Net effect of 2012 redistribution
Effect
#
New ridings
31
Merged riding
1
No change in boundaries
44
Modified boundaries - change in 1st place
11
Modified boundaries - no change in standing
251
Total
338
New and merged seats [ edit ] The following table identifies what party would have held the redistributed ridings based on 2011 results for the new ridings, and the subsequent MPs who were elected.
In Alberta, Vegreville—Wainwright and Westlock—St. Paul were merged to form Lakeland .
Reclassified seats [ edit ] * - Incumbent
Ridings with unchanged boundaries [ edit ] There were 44 ridings whose boundaries were not changed as a result of the redistribution.[10]
* - Incumbent
Seats won/lost by party (ridings with unchanged boundaries)
Party
2011 (redistributed)
Gain from (loss to)
2015
Lib
Con
NDP
BQ
Grn
Liberal
7
8
10
25
Conservative
19
(8)
2
13
New Democratic
17
(10)
(2)
5
Bloc Québécois
1
1
Green
–
–
Total 44
–
(18)
8
(2)
12
–
–
–
–
44
References [ edit ]

.jpg)
.jpg)


 Seats won overall
 Seats won overall, graded by strength of winning party
 Bloc Québécois
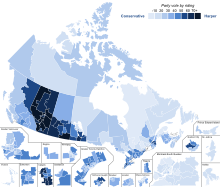 Conservative
 Green
Green Liberal
 NDP
NDP.svg)


 Seats won by riding - equal-area riding map