From Wikipedia, the free encyclopedia
1938 Argentine legislative election|
|
81 of 158 seats in the National Congress |
| Turnout | 68.26% |
|---|
|
This lists parties that won seats. See the complete results below. 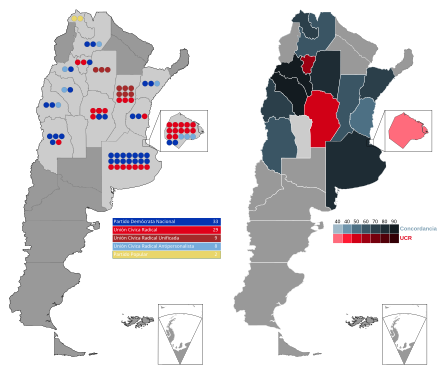 Results by province |
|
Legislative elections were held in Argentina on 6 March 1938. Voter turnout was 68%.
Results[edit]
| Party
|
Votes
|
%
|
Seats won
|
Total seats
|
|
|
Total Concordance
|
1,080,026
|
61.64
|
52
|
83
|
| National Democratic Party (PDN)
|
599,751
|
34.23
|
26
|
57
|
| Santa Fe Radical Civic Union (UCR-SF)
|
157,958
|
9.02
|
6
|
9
|
| Concordance
|
156,325
|
8.92
|
10
|
—
|
| Antipersonalist Radical Civic Union (UCR-A)
|
34,280
|
1.96
|
1
|
9
|
| Unified Radical Party (PRU)
|
36,468
|
2.08
|
2
|
2
|
| Reorganized National Democratic Party (PDN)
|
22,936
|
1.31
|
2
|
—
|
| Unified Radical Civic Union (UCR-U)
|
22,751
|
1.30
|
1
|
3
|
| Liberal Party of Corrientes (PLCo)
|
16,646
|
0.95
|
—
|
1
|
| Popular Party of Jujuy
|
11,700
|
0.67
|
2
|
2
|
| Salta Radical Civic Union
|
9,328
|
0.53
|
1
|
—
|
| Buenos Aires Province Radical Civic Union
|
6,375
|
0.36
|
—
|
—
|
| San Juan Radical Civic Union
|
4,522
|
0.26
|
1
|
—
|
| Blockist Radical Civic Union (UCR-B)
|
966
|
0.06
|
—
|
—
|
| Impersonalist Radical Civic Union
|
20
|
0.00
|
—
|
—
|
|
|
Radical Civic Union (UCR)
|
452,025
|
25.80
|
27
|
65
|
|
|
Socialist Party (PS)
|
99,291
|
5.67
|
—
|
5
|
|
|
Tucumán Radical Civic Union
|
42,312
|
2.41
|
2
|
5
|
|
|
Socialist Workers' Party (PSO)
|
26,530
|
1.51
|
—
|
—
|
|
|
Labour Gathering Party (CO)
|
13,859
|
0.79
|
—
|
—
|
|
|
Servants of the State
|
8,550
|
0.49
|
—
|
—
|
|
|
Independent Democratic Party
|
8,158
|
0.47
|
—
|
—
|
|
|
Radical Civic Union - Opposition Block
|
6,785
|
0.39
|
—
|
—
|
|
|
Radical Party
|
4,071
|
0.23
|
—
|
—
|
|
|
National Labor Party
|
3,357
|
0.19
|
—
|
—
|
|
|
Federalist Radical Civic Union (UCR-F)
|
2,636
|
0.15
|
—
|
—
|
|
|
Independent Radical Civic Union
|
1,878
|
0.11
|
—
|
—
|
|
|
National Democratic Party (Graffignista) (PDN)
|
1,574
|
0.09
|
—
|
—
|
|
|
Others
|
1,078
|
0.06
|
—
|
—
|
| Total
|
1,752,130
|
100
|
81
|
158
|
|
|
|
| Positive votes
|
1,752,130
|
94.89
|
| Blank votes
|
67,951
|
3.68
|
| Invalid votes
|
443
|
0.02
|
| Invalid/blank votes
|
1,006
|
0.05
|
| Tally sheet differences
|
25,021
|
1.36
|
| Total votes
|
1,846,551
|
100
|
| Registered voters/turnout
|
2,705,347
|
68.26
|
| Source:[1]
|
Results by province[edit]
References[edit]


