
File:Perfectly inelastic supply.svg

Size of this PNG preview of this SVG file: 350 × 350 pixels. Other resolutions: 240 × 240 pixels | 480 × 480 pixels | 768 × 768 pixels | 1,024 × 1,024 pixels | 2,048 × 2,048 pixels.
Original file (SVG file, nominally 350 × 350 pixels, file size: 13 KB)
![]() ✓
The source code of this SVG is valid.
✓
The source code of this SVG is valid.
Summary[edit]
| Description |
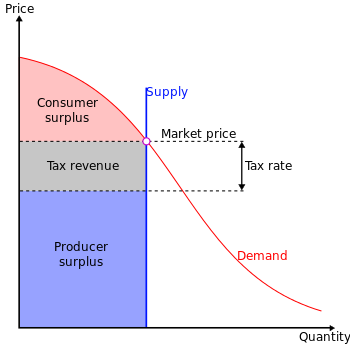
This diagram illustrates the effect of taxation on a market with perfectly inelastic supply and elastic demand. |
|---|---|
| Source |
self-made, based on work by User:SilverStar on Image:Deadweight-loss-price-ceiling.svg |
| Date |
2008-03-17 |
| Author | |
| Permission (Reusing this file) |
See below.
|
Licensing:[edit]
I, the copyright holder of this work, hereby publish it under the following licenses:
 | Permission is granted to copy, distribute and/or modify this document under the terms of the GNU Free Documentation License, Version 1.2 or any later version published by the Free Software Foundation; with no Invariant Sections, no Front-Cover Texts, and no Back-Cover Texts. |
| This work is licensed under the Creative Commons Attribution-ShareAlike 3.0 License. |
You may select the license of your choice.
 | This file is a candidate to be copied to Wikimedia Commons.
Any user may perform this transfer; refer to Wikipedia:Moving files to Commons for details. If this file has problems with attribution, copyright, or is otherwise ineligible for Commons, then remove this tag and DO NOT transfer it; repeat violators may be blocked from editing. Other Instructions
| ||
| |||
File history
Click on a date/time to view the file as it appeared at that time.
| Date/Time | Thumbnail | Dimensions | User | Comment | |
|---|---|---|---|---|---|
| current | 21:07, 1 May 2016 | | 350 × 350 (13 KB) | Hotshot977 (talk | contribs) | Changed tax revenue box to gray to match similar image File:Deadweight-loss-price-ceiling.svg and facilitate comparison. |
| 20:10, 17 August 2009 |  | 350 × 350 (13 KB) | VBGFscJUn3 (talk | contribs) | Changed "taxation rate" line to "tax rate" range, color-coded text for supply and demand curves, removed the words "curves" (redundant) | |
| 13:26, 19 March 2008 |  | 350 × 350 (12 KB) | VBGFscJUn3 (talk | contribs) | As before, but moved Supply Curve text to the right and updated licensing information to allow for older versions of Creative Commons. | |
| 20:12, 18 March 2008 |  | 350 × 350 (12 KB) | VBGFscJUn3 (talk | contribs) | {{Information |Description=This diagram illustrates the effect of taxation on a market with perfectly inelastic supply and elastic demand. |Source=self-made, based on work by User:SilverStar |Date=2008-03-17 |Location= |Author=~~~ |other_versions= }} |
You cannot overwrite this file.
File usage
The following pages on the English Wikipedia use this file (pages on other projects are not listed):