
File:Obama panel v3.png

Size of this preview: 800 × 449 pixels. Other resolutions: 320 × 179 pixels | 640 × 359 pixels | 1,024 × 574 pixels | 1,405 × 788 pixels.
Original file (1,405 × 788 pixels, file size: 261 KB, MIME type: image/png)
| This is a file from the Wikimedia Commons. Information from its description page there is shown below. Commons is a freely licensed media file repository. You can help. |
Understanding the chart
Sources of the charts as follows, starting from the top left and working clockwise:
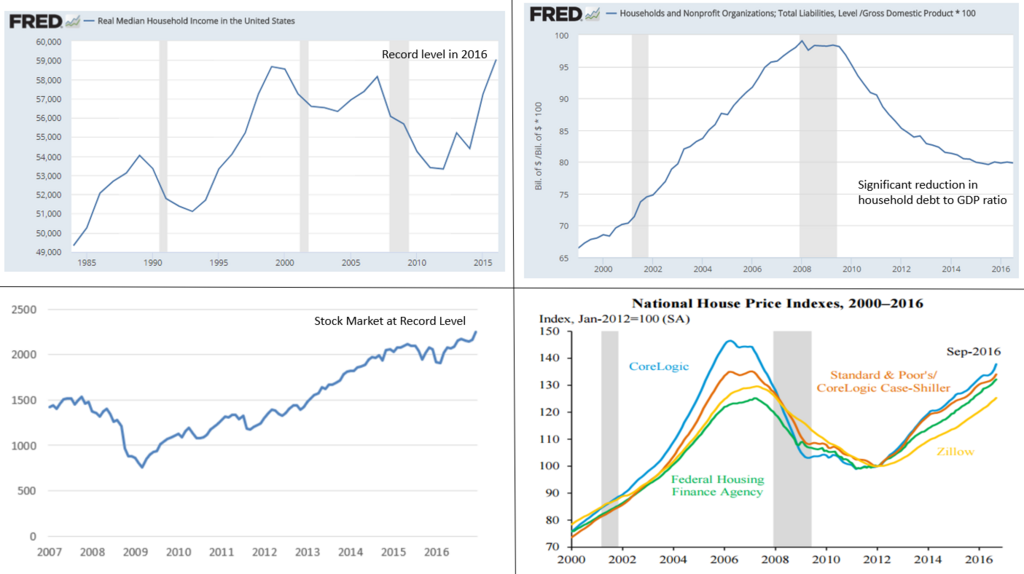
- Real (inflation adjusted) household income fell significantly due to the Great Recession and has been recovering since, with a sizable improvement measured 2014-2016, the latest available at FRED. The 2016 data was the all-time record, surpassing the late 1990's peak.[1]
- Household debt (e.g., mortgages, credit cards, auto loans, etc.) rose in the years prior to the Great Recession. This is another way of looking at the credit bubble that burst, precipitating the crisis as credit dried up. Households increased their savings or lost their homes in foreclosure; both reduced the ratio of debt relative to the size of the economy.[2]
- Housing prices fell dramatically, both cause and effect of the Great Recession. As of late 2016, they were still below the pre-crisis peak on average.[3]
- The stock market performed incredibly well during the Obama era, rising from its lowest point in early 2009, regaining its pre-crisis peak by 2013 and continuing upward thereafter.[4]
References
- ↑ FRED-Real Median Household Income-Retrieved May 18, 2019
- ↑ FRED-Household Debt to GDP-Retrieved May 18, 2019
- ↑ CEA 2017 Economic Report of the President-Chapter One-Eight Years of Recovery and Reinvestment. Whitehouse.gov. Retrieved on December 19, 2016.
- ↑ Yale University-Robert Shiller Website-Retrieved May 18, 2019
Summary
| Description |
English: Four charts describing household variables such as income, debt, stock market, and housing prices. |
| Date | |
| Source | https://www.whitehouse.gov/sites/default/files/docs/chapter_1-eight_years_of_recovery_reinvestment_2017.pdf |
| Author | Farcaster |
Licensing
| This chart is ineligible for copyright and therefore in the public domain, because it consists entirely of information that is common property and contains no original authorship. For more information, see Commons:Threshold of originality § Charts
|
File history
Click on a date/time to view the file as it appeared at that time.
| Date/Time | Thumbnail | Dimensions | User | Comment | |
|---|---|---|---|---|---|
| current | 17:59, 18 May 2019 | | 1,405 × 788 (261 KB) | Farcaster | Updated stock market portion with non-copyrighted data |
| 23:24, 16 September 2017 |  | 1,309 × 731 (230 KB) | Farcaster | Update | |
| 04:52, 31 December 2016 |  | 1,423 × 796 (302 KB) | Farcaster | User created page with UploadWizard |
File usage
The following pages on the English Wikipedia use this file (pages on other projects are not listed):