
File:2008 Canadian election pie chart.svg

Size of this PNG preview of this SVG file: 600 × 400 pixels. Other resolutions: 320 × 213 pixels | 640 × 427 pixels | 1,024 × 683 pixels | 1,280 × 853 pixels | 2,560 × 1,707 pixels.
Original file (SVG file, nominally 600 × 400 pixels, file size: 7 KB)
| This is a file from the Wikimedia Commons. Information from its description page there is shown below. Commons is a freely licensed media file repository. You can help. |
| Description |
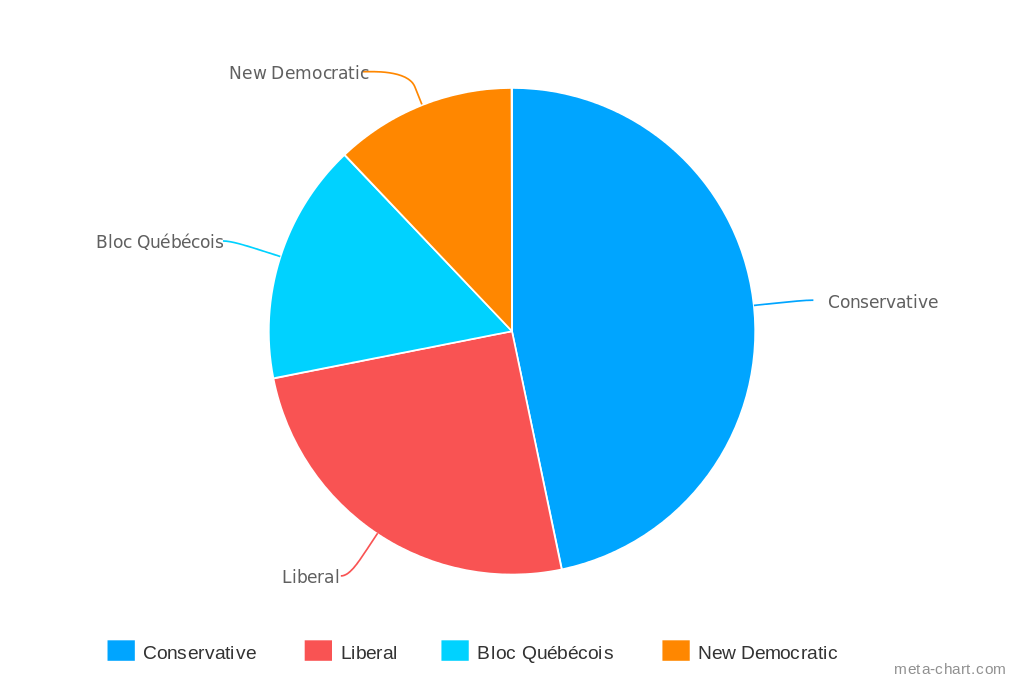
English: A pie chart representing the share of seats in the Canadian House of Commons (as of the 2008 federal election) by each party. Created using Meta-Chart on December 15, 2015. |
||
| Date | |||
| Source | Own work. Created using Meta-Chart. | ||
| Author | Kingofthedead | ||
| Permission (Reusing this file) |
|
File history
Click on a date/time to view the file as it appeared at that time.
| Date/Time | Thumbnail | Dimensions | User | Comment | |
|---|---|---|---|---|---|
| current | 01:32, 16 December 2015 | | 600 × 400 (7 KB) | Kingofthedead | Liberal coloring |
| 01:30, 16 December 2015 |  | 600 × 400 (7 KB) | Kingofthedead | removed Green Party, which did not participate in the election | |
| 01:21, 16 December 2015 |  | 600 × 400 (7 KB) | Kingofthedead | {{Information |Description ={{en|1=A pie chart representing the share of seats in the Canadian House of Commons (as of the 2008 federal election) by each party. Created using Meta-Chart on December 15, 2015.}} |... |
File usage
The following pages on the English Wikipedia use this file (pages on other projects are not listed):
Global file usage
The following other wikis use this file:
- Usage on www.wikidata.org