
San Patricio, Texas
San Patricio, Texas | |
|---|---|
 Location of San Patricio, Texas | |
 | |
| Coordinates: 27°57′33″N 97°46′23″W / 27.95917°N 97.77306°W | |
| Country | United States |
| State | Texas |
| Counties | San Patricio |
| Area | |
| • Total | 3.89 sq mi (10.07 km2) |
| • Land | 3.85 sq mi (9.97 km2) |
| • Water | 0.04 sq mi (0.10 km2) |
| Elevation | 43 ft (13 m) |
| Population (2020) | |
| • Total | 384 |
| • Density | 97.45/sq mi (37.63/km2) |
| Time zone | UTC-6 (Central (CST)) |
| • Summer (DST) | UTC-5 (CDT) |
| ZIP code | 78368 |
| Area code | 361 |
| FIPS code | 48-65612[2] |
| GNIS feature ID | 1346436[3] |
San Patricio is a city in San Patricio counties in the U.S. state of Texas. The population was 384 at the 2020 census.
In the 2000 U.S. Census, a portion of San Patricio was indicated as being in Nueces County.[4] As of the 1990 U.S. Census, the 2010 U.S. Census, and the 2020 U.S. Census, that particular area is indicated as being in San Patricio County.[5][6][7]
Geography[edit]
According to the United States Census Bureau, San Patricio, located at 27°57′33″N 97°46′23″W / 27.95917°N 97.77306°W (27.959196, -97.773134),[8] has a total area of 3.9 square miles (10.0 km2), of which 3.8 square miles (9.9 km2) is land and 0.04 square mile (0.1 km2) (1.03%) is water.
History[edit]
The town was founded in 1829 by empresarios James McGloin and John McMullen. They had received approval from the Mexican government to settle 200 Irish Catholic families on the land[9]—the name meaning Saint Patrick, the patron saint of Ireland. Empresario James Power was involved as well.
The Battle of San Patricio was fought near the town in 1836 during the Texas Revolution.
With the approval of the General Council, Texas revolutionaries James Grant, Frank W. Johnson and Robert C. Morris collaborated on plans to lead an assault on the Mexican town of Matamoros. Recruiting some 300 men, several of whom were native to San Antonio, they gathered provisions from the Alamo and Presidio La Bahia for their expedition.[10] The men needed mounts for their long journey and divided into groups as they traveled toward the coast to capture wild horses.
On February 27, 1836, Mexican General José de Urrea's advanced reconnaissance patrol discovered Frank W. Johnson and about 34 Texians camped at the abandoned Irish settlement of San Patricio. In a surprise attack at 3:30am, Mexican troops fired on the Texian Army and killed about 10 (7 of them Hispanics) and captured 18.[11] Johnson and four others who were captured managed to escape and rejoin James Fannin's command at Goliad. One man, Daniel J. Toler, escaped capture.[12] The men killed were buried in the Old Cemetery on the Hill in San Patricio.[9]
Grant and Morris's party was also surprised by Urrea's army as they camped at Agua Dulce Creek. On March 2, the Mexicans surprised them, killing both Grant and Morris and twelve others. The survivors were taken captured and imprisoned at Matamoros.
In 1846, San Patricio became the second county seat of San Patricio County after Nueces County was partitioned from San Patricio County. In 1893, the county seat was moved to Sinton.[13]
Demographics[edit]
| Census | Pop. | Note | %± |
|---|---|---|---|
| 1880 | 238 | — | |
| 1890 | 315 | 32.4% | |
| 1980 | 210 | — | |
| 1990 | 369 | 75.7% | |
| 2000 | 318 | −13.8% | |
| 2010 | 395 | 24.2% | |
| 2020 | 384 | −2.8% | |
| U.S. Decennial Census[14] 2020[15] | |||
2020 census[edit]
| Race | Number | Percentage |
|---|---|---|
| White (NH) | 191 | 49.74% |
| Asian (NH) | 1 | 0.26% |
| Some Other Race (NH) | 2 | 0.52% |
| Mixed/Multi-Racial (NH) | 13 | 3.39% |
| Hispanic or Latino | 177 | 46.09% |
| Total | 384 |
As of the 2020 United States census, there were 384 people, 155 households, and 116 families residing in the city.
2000 census[edit]
As of the census[2] of 2000, there were 318 people, 113 households, and 89 families residing in the city. The population density was 82.7 inhabitants per square mile (31.9/km2). There were 124 housing units at an average density of 32.3 per square mile (12.5/km2). The racial makeup of the city was 81.45% White, 0.94% African American, 0.63% Native American, 14.47% from other races, and 2.52% from two or more races. Hispanic or Latino of any race were 39.94% of the population.
There were 113 households, out of which 42.5% had children under the age of 18 living with them, 64.6% were married couples living together, 8.8% had a female householder with no husband present, and 21.2% were non-families. 18.6% of all households were made up of individuals, and 8.8% had someone living alone who was 65 years of age or older. The average household size was 2.81 and the average family size was 3.22.
The population in the city was spread out, with 33.0% under the age of 18, 4.4% from 18 to 24, 33.3% from 25 to 44, 19.8% from 45 to 64, and 9.4% who were 65 years of age or older; the median age was 36 years. For every 100 females, there were 102.5 males. For every 100 females age 18 and over, there were 91.9 males.
The median income for a household in the city was $32,386, and the median income for a family was $40,313. Males had a median income of $31,250 versus $19,063 for females. The per capita income for the city was $13,531. About 12.6% of families and 14.9% of the population were below the poverty line, including 17.9% of those under age 18 and 14.7% of those age 65 or over.
Education[edit]
The City of San Patricio is served by the Mathis Independent School District.[19]
References[edit]
- ^ "2019 U.S. Gazetteer Files". United States Census Bureau. Retrieved August 7, 2020.
- ^ a b "U.S. Census website". United States Census Bureau. Retrieved January 31, 2008.
- ^ "US Board on Geographic Names". United States Geological Survey. October 25, 2007. Retrieved January 31, 2008.
- ^ "CENSUS 2000 BLOCK MAP: NUECES County (Page 2)" (PDF). 2000 U.S. Census. U.S. Census Bureau. Retrieved February 16, 2024.
- ^ "1990 COUNTY BLOCK MAP (RECREATED): NUECES County (Page 2)" (PDF). U.S. Census Bureau. Retrieved February 16, 2024.
- ^ "2010 CENSUS - CENSUS BLOCK MAP: Nueces County, TX (Page 2)" (PDF). 2010 U.S. Census. U.S. Census Bureau. Retrieved February 16, 2024.
- ^ "2020 CENSUS - CENSUS BLOCK MAP: Nueces County, TX" (PDF). U.S. Census Bureau. Retrieved February 16, 2024.
- ^ "US Gazetteer files: 2010, 2000, and 1990". United States Census Bureau. February 12, 2011. Retrieved April 23, 2011.
- ^ a b Handbook of Texas Online - San Patricio
- ^ Todish et al. (1998), p. 29.
- ^ Keith Guthrie, "SAN PATRICIO, BATTLE OF," Handbook of Texas Online (https://tshaonline.org/handbook/online/articles/qfs03), accessed June 09, 2011. Published by the Texas State Historical Association.
- ^ Thomas W. Cutrer, "TOLER, DANIEL J.," Handbook of Texas Online (https://tshaonline.org/handbook/online/articles/fto11), accessed June 09, 2011. Published by the Texas State Historical Association.
- ^ Guthrie, Keith (February 17, 2016). "San Patricio County". Handbook of Texas. Texas State Historical Association. Retrieved March 29, 2020.
- ^ "Census of Population and Housing". Census.gov. Retrieved June 4, 2015.
- ^ "2020 Census Data". data.census.gov.
- ^ "Explore Census Data". data.census.gov. Retrieved May 21, 2022.
- ^ https://www.census.gov/ [not specific enough to verify]
- ^ "About the Hispanic Population and its Origin". www.census.gov. Retrieved May 18, 2022.
- ^ "2020 CENSUS - SCHOOL DISTRICT REFERENCE MAP: San Patricio County, TX" (PDF). U.S. Census Bureau. Retrieved February 15, 2024. - Text list - 2010 map and 2010 list
Municipalities and communities of San Patricio County, Texas, United States | ||
|---|---|---|
| Cities | 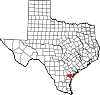 | |
| Towns | ||
| CDPs | ||
| Unincorporated community | ||
| Footnotes | ‡This populated place also has portions in an adjacent county or counties | |
| International | |
|---|---|
| National | |