
File:GevDensity 2.svg

Size of this PNG preview of this SVG file: 600 × 600 pixels. Other resolutions: 240 × 240 pixels | 480 × 480 pixels | 768 × 768 pixels | 1,024 × 1,024 pixels | 2,048 × 2,048 pixels | 630 × 630 pixels.
Original file (SVG file, nominally 630 × 630 pixels, file size: 62 KB)
| This is a file from the Wikimedia Commons. Information from its description page there is shown below. Commons is a freely licensed media file repository. You can help. |
Summary
| Description |
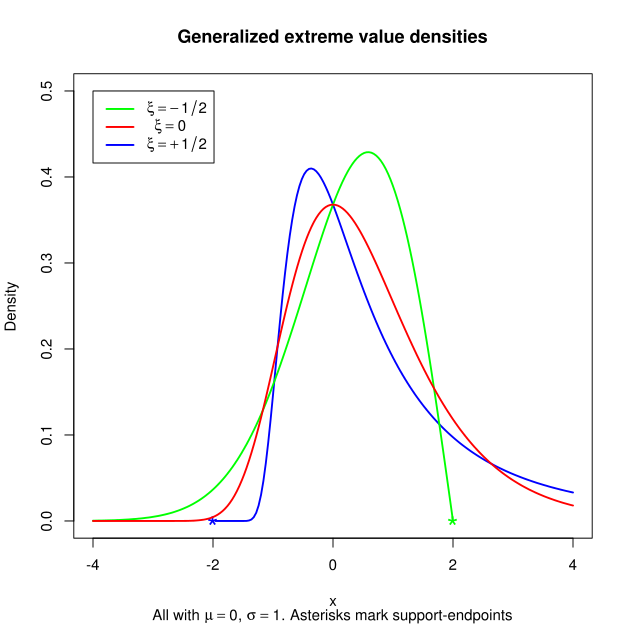
English: Generallised extreme value distribution. |
| Date | 4 January 2014 (original upload date) |
| Source | Created by R D Gill, 4 January 2013, using R script |
| Author | R D Gill |
| Other versions |
 |
Computer code
svg("GevDensity.svg")
x <- seq(from = -4, to = +4, length = 200)
xi <- 0.5
s <- (1 + xi * x)^(-1/xi -1)
t <- (1 + xi * x)^(-1/xi)
u <-  x >  -1/xi
plot(x, s*exp(-t)*u, type="l", col="blue",
ylim=c(0,0.5), lwd=2,
main = "Generalized extreme value densities",
ylab = "Density", xlab = "x",
sub = "all with mu=0, sigma=1")
xi <- -0.5
s <- (1 + xi * x)^(-1/xi -1)
t <- (1 + xi * x)^(-1/xi)
u <- x < -1/xi
lines(x, s*exp(-t)*u, col="green", lwd=2)
xi <- 0
s <- exp(-x)
t <- exp(-x)
lines(x,s*exp(-t), col="red", lwd=2)
legend(-4,0.5,c("xi = -0.5","xi=0","xi=+0.5"),lwd=2,col=c("green","red","blue"))
graphics.off()
Licensing
This file is licensed under the Creative Commons Attribution-Share Alike 3.0 Unported license.
- You are free:
- to share – to copy, distribute and transmit the work
- to remix – to adapt the work
- Under the following conditions:
- attribution – You must give appropriate credit, provide a link to the license, and indicate if changes were made. You may do so in any reasonable manner, but not in any way that suggests the licensor endorses you or your use.
- share alike – If you remix, transform, or build upon the material, you must distribute your contributions under the same or compatible license as the original.
Original upload log
The original description page was here. All following user names refer to en.wikipedia.
| Date/Time | Dimensions | User | Comment |
|---|---|---|---|
| 2014-01-05 13:46 | 630×630× (63236 bytes) | Gill110951 | More small improvements (support endpoints marked, better legend) |
| 2014-01-05 09:50 | 630×630× (56224 bytes) | Gill110951 | Improved annotation (Greek symbols instead of words) |
| 2014-01-04 19:38 | 630×630× (55321 bytes) | Gill110951 | {{cc-by-sa-3.0|Created by R D Gill, 4 January 2013, using R script} svg("GevDensity.svg") x <- seq(from = -4, to = +4, length = 200) xi <- 0.5 s <- (1 + xi * x)^(-1/xi -1) t <- (1 + xi * x)^(-1/xi) u <- x > -1/xi plot(x, s*exp(-t)*u, type="l",... |
File history
Click on a date/time to view the file as it appeared at that time.
| Date/Time | Thumbnail | Dimensions | User | Comment | |
|---|---|---|---|---|---|
| current | 19:01, 14 November 2015 | | 630 × 630 (62 KB) | OgreBot | (BOT): Reverting to most recent version before archival |
| 19:01, 14 November 2015 |  | 630 × 630 (54 KB) | OgreBot | (BOT): Uploading old version of file from en.wikipedia; originally uploaded on 2014-01-04 19:38:56 by Gill110951 | |
| 18:59, 14 November 2015 |  | 630 × 630 (62 KB) | Stefan2 | Transferred from en.wikipedia |
File usage
The following pages on the English Wikipedia use this file (pages on other projects are not listed):
Global file usage
The following other wikis use this file:
- Usage on ca.wikipedia.org
- Usage on de.wikipedia.org
- Usage on fa.wikipedia.org