
File:BenfordBroad.png
No higher resolution available.
BenfordBroad.png (500 × 165 pixels, file size: 3 KB, MIME type: image/png)
| This is a file from the Wikimedia Commons. Information from its description page there is shown below. Commons is a freely licensed media file repository. You can help. |
Summary
| Description |
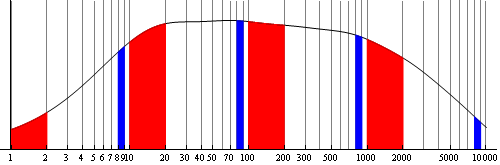
English: A broad probability distribution on a log scale, with bars colored in to show why Benford's law holds |
| Source | Own work |
| Author | Sbyrnes321 |

|
This graph image could be re-created using vector graphics as an SVG file. This has several advantages; see Commons:Media for cleanup for more information. If an SVG form of this image is available, please upload it and afterwards replace this template with
{{vector version available|new image name}}.
It is recommended to name the SVG file “BenfordBroad.svg”—then the template Vector version available (or Vva) does not need the new image name parameter. |
Licensing
| I, the copyright holder of this work, release this work into the public domain. This applies worldwide. In some countries this may not be legally possible; if so: I grant anyone the right to use this work for any purpose, without any conditions, unless such conditions are required by law. |
(* Source code written in Mathematica 6.0, by Steve Byrnes, 2008. I release this code into the public domain. *)

LabelsList = {1, 2, 3, 4, 5, 6, 7, 8, 9, 10, 20, 30, 40, 50, 70, 100, 200, 300, 500, 1000, 2000, 5000, 10000};
LineList = {1, 2, 3, 4, 5, 6, 7, 8, 9, 10, 20, 30, 40, 50, 60, 70, 80, 90, 100, 200, 300, 400, 500, 600,
   700, 800, 900, 1000, 2000, 3000, 4000, 5000, 6000, 7000, 8000, 9000, 10000};

ff[x_] :=
  x Exp[-.1 x] .1 + x Exp[-.03 x] .03 +  x Exp[-.01 x] .01 +
   x Exp[-.003 x] .003 + x Exp[-.001 x] .001 + x Exp[-.0003 x] .0003;

firstdig1[xx_] :=
  (1 < xx && xx < 2) || (10 < xx && xx < 20) || (100 < xx && xx < 200) || (1000 < xx && xx < 2000);
firstdig8[xx_] :=
  (8 < xx && xx < 9) || (80 < xx && xx < 90) || (800 < xx && xx < 900) || (8000 < xx && xx < 9000);

plotA = LogLinearPlot[{ff[x], If[firstdig1[x], ff[x], 0], If[firstdig8[x], ff[x], 0]}, {x, .99, 10100},
  Ticks -> {LabelsList, {}}, PlotRange -> {0, 1}, TicksStyle -> Directive[Black, 10],
  GridLines -> {LineList, {}}, ImageSize -> 401, AspectRatio -> .3,
  Filling -> {2 -> Bottom, 3 -> Bottom}, PlotPoints -> 1000, PlotStyle -> {Black, Red, Blue},
  FillingStyle -> {2 -> Red, 3 -> Blue}]

Export["plotA.gif", plotA, ImageSize -> 500]
Original upload log
| Date/Time | Dimensions | User | Comment |
|---|---|---|---|
| 9 October 2008, 04:44:33 | 500 × 165 (18087 bytes) | Sbyrnes321 (talk · contribs) | {{Information |Description={{en|1=A broad probability distribution on a log scale, with bars colored in to show why Benford's law holds}} |Source=Own work by uploader |Author=[[User:Sbyrnes321|Sbyrnes321]] |Date= |Permission= |other_versions= }} <!--{{Im |
File history
Click on a date/time to view the file as it appeared at that time.
| Date/Time | Thumbnail | Dimensions | User | Comment | |
|---|---|---|---|---|---|
| current | 02:10, 24 August 2014 | 500 × 165 (3 KB) | GifTagger | Bot: Converting file to superior PNG file. (Source: BenfordBroad.gif). This GIF was problematic due to non-greyscale color table. |
File usage
The following pages on the English Wikipedia use this file (pages on other projects are not listed):
Global file usage
The following other wikis use this file:
- Usage on ja.wikipedia.org
- Usage on pl.wikipedia.org
- Usage on zh.wikipedia.org