
Demographics of Slough
| Demographics of Slough | |
|---|---|
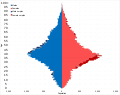
 Population pyramid of Slough | |
| Population | 149,400 (2016 estimate) |

This article is intended to give an overview of the demography of Slough. In 2016, Slough had a population of 149,000 people.

Population[edit]
The modern town of Slough grew from the parish of Upton-cum-Chalvey, Buckinghamshire, England. The populations given below are for the successive institutional areas of the principal local government level that could be recognised as Slough, now in Berkshire.
| Year | Population | Notes |
|---|---|---|
| 1801 | 1,018[1] | Parish of Upton-cum-Chalvey |
| 1811 | 1,083[1] | |
| 1821 | 1,268[1] | |
| 1831 | 1,502[1] | |
| 1841 | 2,296[1] | |
| 1851 | 3,573[1] | |
| 1861 | 4,688[1] | |
| 1871 | 5,940[1] | |
| 1881 | 7,030[1] | |
| 1891 | 7,700[1] | |
| 1901 | 11,453[1] | Slough Urban District from 1894; area enlarged in 1900[2] |
| 1911 | 14,982[1] | |
| 1921 | 16,392[1] | |
| 1931 | 33,612[1] | area enlarged in 1930/1931[2] |
| 1939 | 50,620[1] | estimate (1941 census not taken due to World War II):Municipal Borough from 1938 |
| 1951 | 66,471[1] | |
| 1961 | 80,781[1] | |
| 1971 | 87,075[1] | |
| 1981 | 96,512[3] | Borough of Slough in Berkshire and area enlarged from 1974 |
| 1991 | 101,066[3] | |
| 2001 | 119,070[4] | Area enlarged in 1995: Unitary Authority from 1998 |
| 2011 | 140,200[5] | Up 16.3% on the 2001 census, and 6.9% higher than the previous mid-2010 population estimate |
| 2016 | 149,400 | ONS - based on 2012 population trends |
Ethnicity[edit]


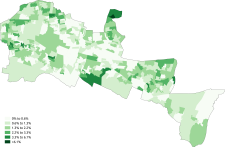
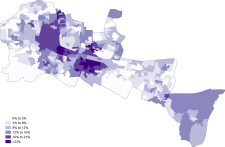
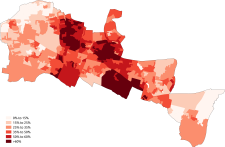
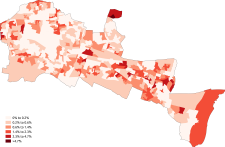
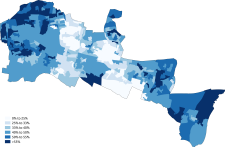
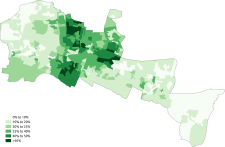
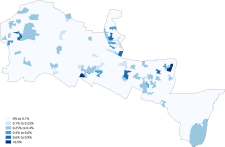
The following table shows the ethnic group of respondents in the 1991, 2001 and 2011 censuses in Slough. Slough is a majority-minority town, with no ethnic group or broad multi-ethnic group being the majority, having been this way since the late 2000s. The White British make up the largest group at 34.5% of the population, having declined from a majority status of 58.3% in 2001, this decline coincides with the overall decline of White residents in the town from nearly two thirds in 1991 (72.3%) to less the majority (45.7%) in 2011. In conjunction, Asian British people have risen from nearly a quarter of the town's population in 1991 (23.9%) to nearly 40% in 2011, the largest of which is British Pakistanis who surpassed British Indians in 2011 as the largest Asian group. Black British residents have also increased, with the majority of growth coming from Black Africans who have increased from 0.4% in 1991 to 5.4% in 2011, of which surpassed the Black Caribbean group, who was 2.2% of the population, in 2011 as well.
| Ethnic Group | 1971 estimations[6] | 1981 estimations[7] | 1991[8] | 2001[9] | 2011[10] | 2021[11] | ||||||
|---|---|---|---|---|---|---|---|---|---|---|---|---|
| Number | % | Number | % | Number | % | Number | % | Number | % | Number | % | |
| White: Total | 78,367 | 90% | 75,734 | 79% | 73,100 | 72.32% | 75,843 | 63.70% | 64,053 | 45.69% | 57,134 | 35.9% |
| White: British | – | – | – | – | – | – | 69,441 | 58.32% | 48,401 | 34.52% | 38,101 | 24.0% |
| White: Irish | – | – | – | – | 3,241 | 3.2% | 2,489 | 2.09% | 1,607 | 1.15% | 1143 | 0.7% |
| White: Gypsy or Irish Traveller[note 1] | – | – | – | – | – | – | – | – | 220 | 0.16% | 237 | 0.1% |
| – | – | – | – | – | – | – | – | – | – | 357 | 0.2% | |
| White: Other | – | – | – | – | – | – | 3,913 | 3.29% | 13,825 | 9.86% | 17,296 | 10.9% |
| Asian or Asian British: Total | – | – | – | – | 24,160 | 23.9% | 33,621 | 28.24% | 55,697 | 39.73% | 74,093 | 46.9% |
| Asian or Asian British: Indian | – | – | – | – | 12,600 | 12.5% | 16,719 | 14.04% | 21,922 | 15.64% | 30,209 | 19.1% |
| Asian or Asian British: Pakistani | – | – | – | – | 9,218 | 9.1% | 14,360 | 12.06% | 24,869 | 17.74% | 34,317 | 21.7% |
| Asian or Asian British: Bangladeshi | – | – | – | – | 99 | 171 | 0.14% | 549 | 0.39% | 910 | 0.6% | |
| Asian or Asian British: Chinese[note 2] | – | – | – | – | 258 | 349 | 0.29% | 797 | 0.57% | 594 | 0.4% | |
| Asian or Asian British: Other Asian | – | – | – | – | 910 | 2,022 | 1.70% | 7,560 | 5.39% | 8,063 | 5.1% | |
| Black or Black British: Total | – | – | – | – | 3,806 | 3.76% | 6,026 | 5.06% | 12,115 | 8.64% | 11,992 | 7.5% |
| Black or Black British: Caribbean | – | – | – | – | 2,732 | 2.7% | 3,470 | 2.91% | 3,096 | 2.21% | 2,771 | 1.7% |
| Black or Black British: African | – | – | – | – | 417 | 0.4% | 2,275 | 1.91% | 7,548 | 5.38% | 7,815 | 4.9% |
| Black or Black British: Other Black | – | – | – | – | 657 | 281 | 0.24% | 1,471 | 1.05% | 1,406 | 0.9% | |
| Mixed: Total | – | – | – | – | – | – | 2,778 | 2.33% | 4,758 | 3.39% | 6,311 | 4% |
| Mixed: White and Black Caribbean | – | – | – | – | – | – | 1,116 | 0.94% | 1,667 | 1.19% | 1,854 | 1.2% |
| Mixed: White and Black African | – | – | – | – | – | – | 224 | 0.19% | 607 | 0.43% | 824 | 0.5% |
| Mixed: White and Asian | – | – | – | – | – | – | 845 | 0.71% | 1,429 | 1.02% | 1,945 | 1.2% |
| Mixed: Other Mixed | – | – | – | – | – | – | 593 | 0.50% | 1,055 | 0.75% | 1,688 | 1.1% |
| Other: Total | – | – | – | – | 1,075 | 1.06% | 799 | 0.67% | 3,582 | 2.55% | 8,970 | 5.7% |
| Other: Arab[note 3] | – | – | – | – | – | – | – | – | 928 | 0.66% | 1,826 | 1.2% |
| Other: Any other ethnic group | – | – | – | – | 1,075 | 1.06% | 799 | 0.67% | 2,654 | 1.89% | 7,144 | 4.5% |
| Ethnic minority | 8,708 | 10% | 20,177 | 21% | 29,041 | 27.7% | 43,224 | 36.3% | 76,152 | 54.3% | 101,366 | 64.1% |
| Total | 87,075 | 100% | 95,911 | 100% | 101,066 | 100% | 119,067 | 100% | 140,205 | 100% | 158,500 | 100% |
Notes for table above
-
 White
White -
 White-British
 -
 White-Irish
 -
 White-Other
 -
 Asian
Asian -
 Asian-Indian
 -
 Asian-Pakistani
 -
 Asian-Bangladeshi
 -
 Asian-Chinese
 -
 Black
Black -
 Black-African
 -
 Black-Caribbean
 -
 Other-Arab


Ethnicity of school pupils[edit]
Since statistics on the ethnicity of school pupils have been collected, White students, the majority being the native White British, have been in the minority. As such Slough schools were in a majority-minority state in-till 2018 when Asian British pupils became the majority, of which had surpassed White students in the mid-2000s. In the Asian British multi-ethnic group, British Pakistanis are the largest at 25.8% and are the largest group of all groups in the town. Black British school pupils increased in proportional size between 2004 and 2012 peaking at 9.1%, but have declined since then to 7.2% in 2022. Mixed school pupils have also been in proportional increase and now make up a little over 1 in 10 in schools (11.3%) from 5.9% in 2004.
| Ethnic group | School year[12][13] | |||||||||||
|---|---|---|---|---|---|---|---|---|---|---|---|---|
| 2004 | 2008 | 2012 | 2015/16 | 2019/20 | 2021/2022 | |||||||
| Number | % | Number | % | Number | % | Number | % | Number | % | Number | % | |
| White: Total | 7,670 | 44.3% | 7,110 | 37.9% | 6,820 | 32.4% | 7,218 | 29.5% | 8,422 | 25.8% | 7,860 | 23.3% |
| White: British | 6,940 | 40% | 5,154 | 27.5% | 4,581 | 21.8% | 4,308 | 17.3% | 4,453 | 13.6% | 4,084 | 12.1% |
| White: Irish | 200 | 158 | 148 | 114 | 0.5% | 110 | 0.3% | 81 | 0.2% | |||
| White: Traveller of Irish heritage | 10 | 25 | 29 | 34 | 0.0% | 25 | 0.1% | 22 | 0.1% | |||
| White: Gypsy/Roma | 70 | 54 | 110 | 158 | 0.6% | 244 | 0.7% | 240 | 0.7% | |||
| White: Other | 470 | 1,719 | 1,951 | 2,762 | 11.1% | 3,610 | 11.1% | 3,433 | 10.2% | |||
| Asian / Asian British: Total | 7,040 | 40.6% | 8,360 | 44.6% | 9,785 | 46.5% | 12,108 | 48.6% | 16,769 | 51.4% | 17,725 | 52.4% |
| Asian / Asian British: Indian | 2,830 | 16.3% | 3,287 | 17.5% | 3,758 | 20.0% | 4,486 | 18.0% | 6,565 | 20.1% | 7,262 | 21.5% |
| Asian / Asian British: Pakistani | 3,620 | 20.9% | 4,164 | 22.2% | 4,923 | 23.4% | 6,191 | 24.8% | 8,420 | 25.8% | 8,687 | 25.8% |
| Asian / Asian British: Bangladeshi | 60 | 92 | 116 | 149 | 0.6% | 261 | 0.8% | 256 | 0.8% | |||
| Asian / Asian British: Chinese | 60 | 63 | 60 | 46 | 0.2% | 49 | 0.2% | 97 | 0.1% | |||
| Asian / Asian British: Other Asians | 470 | 754 | 926 | 1,236 | 5.0% | 1,474 | 4.5% | 1,423 | 4.2% | |||
| Black / Black British: Total | 1,100 | 6.4% | 1,580 | 8.4% | 1,925 | 9.1% | 2,150 | 8.5% | 2,454 | 7.5% | 2,417 | 7.2% |
| Black: Caribbean | 340 | 362 | 357 | 332 | 1.3% | 343 | 1.1% | 339 | 1.0% | |||
| Black: African | 660 | 3.8% | 1,133 | 6.0% | 1,454 | 6.9% | 1,658 | 6.6% | 1,899 | 5.8% | 1,847 | 5.5% |
| Black: Other Blacks | 110 | 91 | 116 | 160 | 0.6% | 212 | 0.6% | 231 | 0.7% | |||
| Mixed / British Mixed | 1,030 | 5.9% | 1,190 | 6.3% | 1,690 | 8% | 2,125 | 8.5% | 3,188 | 9.8% | 3,817 | 11.3% |
| Other: Total | 290 | 1.7% | 391 | 2.1% | 655 | 3.1% | 911 | 3.7% | 1,261 | 3.9% | 1,349 | 4.0% |
| Unclassified | 190 | 1.1% | 37 | - | 173 | 0.8% | 270 | 1.1% | 551 | 1.7% | 590 | 1.7% |
| Total: | 17,320 | 100% | 18,750 | 100% | 21,050 | 100% | 24,941 | 100% | 32,665 | 100% | 33,720 | 100% |
Country of birth[edit]
| Country of birth | 2011 number | 2021 number |
|---|---|---|
| 83,230 | 87,350 | |
| 11,544 | 17,107 | |
| 11,244 | 14,418 | |
| 8,341 | 8,912 | |
| 467 | 3,551 | |
| 2,183 | 1,940 | |
| 1,219 | 1,385 | |
| 1,247 | 1,336 | |
| 621 | 1,125 | |
| 828 | 1,064 |
- Population pyramids of country of birth groups in Slough
-
 UK born
 -
 Foreign born: Total


Languages[edit]
Top 10 main languages spoken in Slough according to 2011 census and 2021 census are shown below.[16]
| Rank | Language | 2011 | 2021 |
|---|---|---|---|
| Usual residents aged 3+ | Usual residents aged 3+ | ||
| 1 | English | 96,508 | 110,212 |
| 2 | Punjabi | 8,247 | 9,527 |
| 3 | Polish | 8,249 | 7,724 |
| 4 | Urdu | 6,568 | 6,497 |
| 5 | Romanian | 401 | 3,275 |
| 6 | Tamil | 860 | 1,224 |
| 7 | Hindi | 825 | 1,148 |
| 8 | Telugu | 275 | 1,066 |
| 9 | Arabic | 703 | 983 |
| 10 | Somali | 938 | 772 |
Religion[edit]

The following table shows the religion of respondents in the 2001, 2011 and 2021 censuses[17] in Slough. With Slough having one of the highest British Asian communities in Britain, the British Muslim, British Hindus and Sikh communities are all overrepresented compared to the national average.
| Religion | 2001[18] | 2011[19] | 2021[20] | |||
|---|---|---|---|---|---|---|
| Number | % | Number | % | Number | % | |
| Christian | 63,993 | 53.75% | 57,726 | 41.17% | 50,664 | 31.96% |
| Buddhist | 294 | 0.25% | 743 | 0.53% | 776 | 0.5% |
| Hindu | 5,340 | 4.48% | 8,643 | 6.16% | 12,343 | 7.79% |
| Jewish | 139 | 0.12% | 87 | 0.06% | 85 | 0.1% |
| Muslim | 15,897 | 13.35% | 32,655 | 23.29% | 46,661 | 29.44% |
| Sikh | 10,820 | 9.09% | 14,889 | 10.62% | 17,985 | 11.35% |
| Any Other religion | 358 | 0.30% | 482 | 0.34% | 716 | 0.5% |
| No religion | 13,061 | 10.97% | 17,024 | 12.14% | 20,726 | 13.08% |
| Religion not stated | 9,165 | 7.70% | 7,956 | 5.67% | 8,544 | 5.39% |
| Total | 119,067 | 100.00% | 140,205 | 100.00% | 158,500 | 100.00% |
-
 Christianity
 -
 Islam
Islam -
 Judaism
 -
 Hinduism
 -
 Sikhism
 -
 Buddhism
 -
 Other religion
 -
 No religion


See also[edit]
- Demographics of the United Kingdom
- Demographics of England
- Demographics of London
- Demographics of Birmingham
- Demographics of Greater Manchester
- List of English cities by population
- List of English districts by population
- List of English districts and their ethnic composition
- List of English districts by area
- List of English districts by population density
References[edit]
- ^ a b c d e f g h i j k l m n o p q r p 153, The History of Slough, Maxwell Fraser, Slough Corporation, 1973
- ^ a b p 151, The History of Slough, Maxwell Fraser, Slough Corporation, 1973
- ^ a b Office for National Statistics, downloaded 31 December 2006[permanent dead link]
- ^ A Vision of Britain (Accessed 31 December 2006)
- ^ (Accessed 29 November 2013)
- ^ Masom, Grant (2020), Masom, Grant (ed.), "Where We Live Now: A Twentieth-Century Industrial Town", Local Churches in New Urban Britain, 1890-1975: “The Greatest Challenge”?, Cham: Springer International Publishing, pp. 37–71, doi:10.1007/978-3-030-48095-0_2, ISBN 978-3-030-48095-0, S2CID 226649228, retrieved 10 January 2023
- ^ Equality, Commission for Racial (1985). "Ethnic minorities in Britain: statistical information on the pattern of settlement". Commission for Racial Equality: Table 2.2.
- ^ Data is taken from United Kingdom Casweb Data services of the United Kingdom 1991 Census on Ethnic Data for England, Scotland and Wales (Table 6)
- ^ "Office of National Statistics; 2001 Census Key Statistics". webarchive.nationalarchives.gov.uk. Retrieved 7 September 2021.
- ^ "2011 Census: Ethnic Group, local authorities in England and Wales". webarchive.nationalarchives.gov.uk. Retrieved 15 December 2021.
- ^ "Ethnic group - Office for National Statistics". www.ons.gov.uk. Retrieved 29 November 2022.
- ^ "School and pupil characteristics". webarchive.nationalarchives.gov.uk. Retrieved 8 November 2022.
- ^ "Schools, pupils and their characteristics, Academic Year 2021/22". explore-education-statistics.service.gov.uk. Retrieved 9 September 2022.
- ^ "Data Viewer - Nomis - Official Census and Labour Market Statistics".
- ^ "Custom dataset - Office for National Statistics".
- ^ "Download:local authorities: county / unitary". NOMIS. Retrieved 17 June 2015.
- ^ "Religion, England and Wales - Office for National Statistics". www.ons.gov.uk. Retrieved 30 November 2022.
- ^ "2001 census - theme tables". Retrieved 17 June 2015.
- ^ "Download:local authorities: county / unitary". NOMIS. Retrieved 17 June 2015.
- ^ "Home - Office for National Statistics". www.ons.gov.uk. Retrieved 29 November 2022.